Market Snapshot
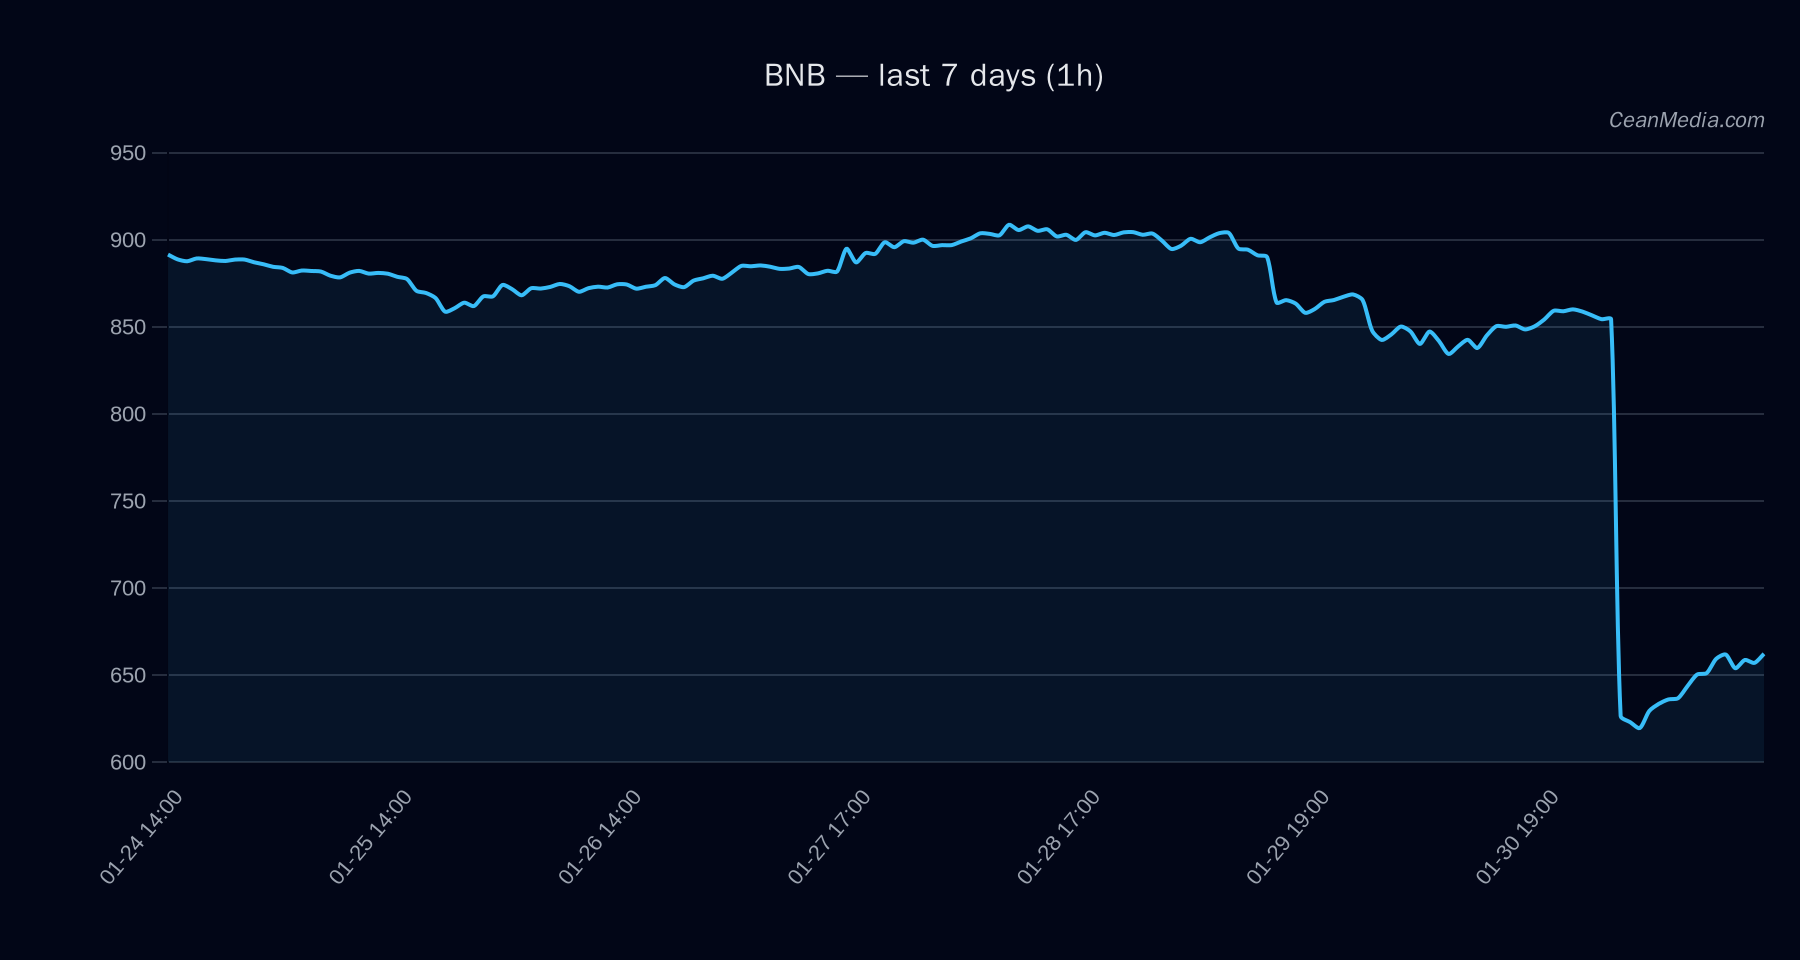
BNB trades near key support and resistance, with a price around 666.64 and mixed near-term signals. The asset sits between the near-term support at 653 and resistance at 680. A break above 680 suggests upside to approximately 693.57–707.17, while a break below 653 signals downside toward 640.24–627.17. Market breadth is weak, and volatility is characterized as elevated.
Technical Analysis: BNB
: Up (47%) : EMA12 < EMA26 (bearish cross), SMA50 < SMA200 (bearish), RSI 32 (oversold condition) : 686.5384 – 705.8833 : 1h close > 680 → 693.57–707.17 : 1h close < 653 → 640.24–627.17
Drivers
- EMA slope: -0.0012
- Funding z-score: -0.77
- BASIS z-score: -3.30
- Order-book imbalance (EMA5): -0.06
- Volatility regime: Elevated
- BTC vol/regime: 1
- Distance from MA: -0.19
- Drawdown (30d): -30.685%
ETF Flows (BTC/ETH)
Contextual data for ETF flows is provided for BTC and ETH and is not a primary signal for BNB pricing. The BTC ETF shows consistent net outflows over 1D, 5D, and 10D horizons (−$434.1M, −$1.03B, −$1.67B, respectively). ETH ETF data mirrors a similar outflow pattern (−$77.9M, −$312.6M, −$337.8M). These figures reflect broader risk-on/off sentiment and liquidity shifts in the crypto ecosystem but should not be used in isolation to infer BNB-specific momentum.
What to Watch Next
- Monitor a close above 680 for potential upside acceleration toward 693.57–707.17.
- Watch for a break below 653 to confirm near-term downside targets around 640–627.
- Track volatility regime and RSI behavior for signs of regained momentum or renewed oversold conditions.
- Consider broader market undercurrents from BTC/ETH ETF flows as contextual backdrop, not a primary driver for BNB.
Hashtags: #BNB #Binance #CryptoAnalysis #TechnicalAnalysis #ETFFlows #BTC #ETH #CryptoMarkets #MarketOutlook #TradingStrategy #Volatility