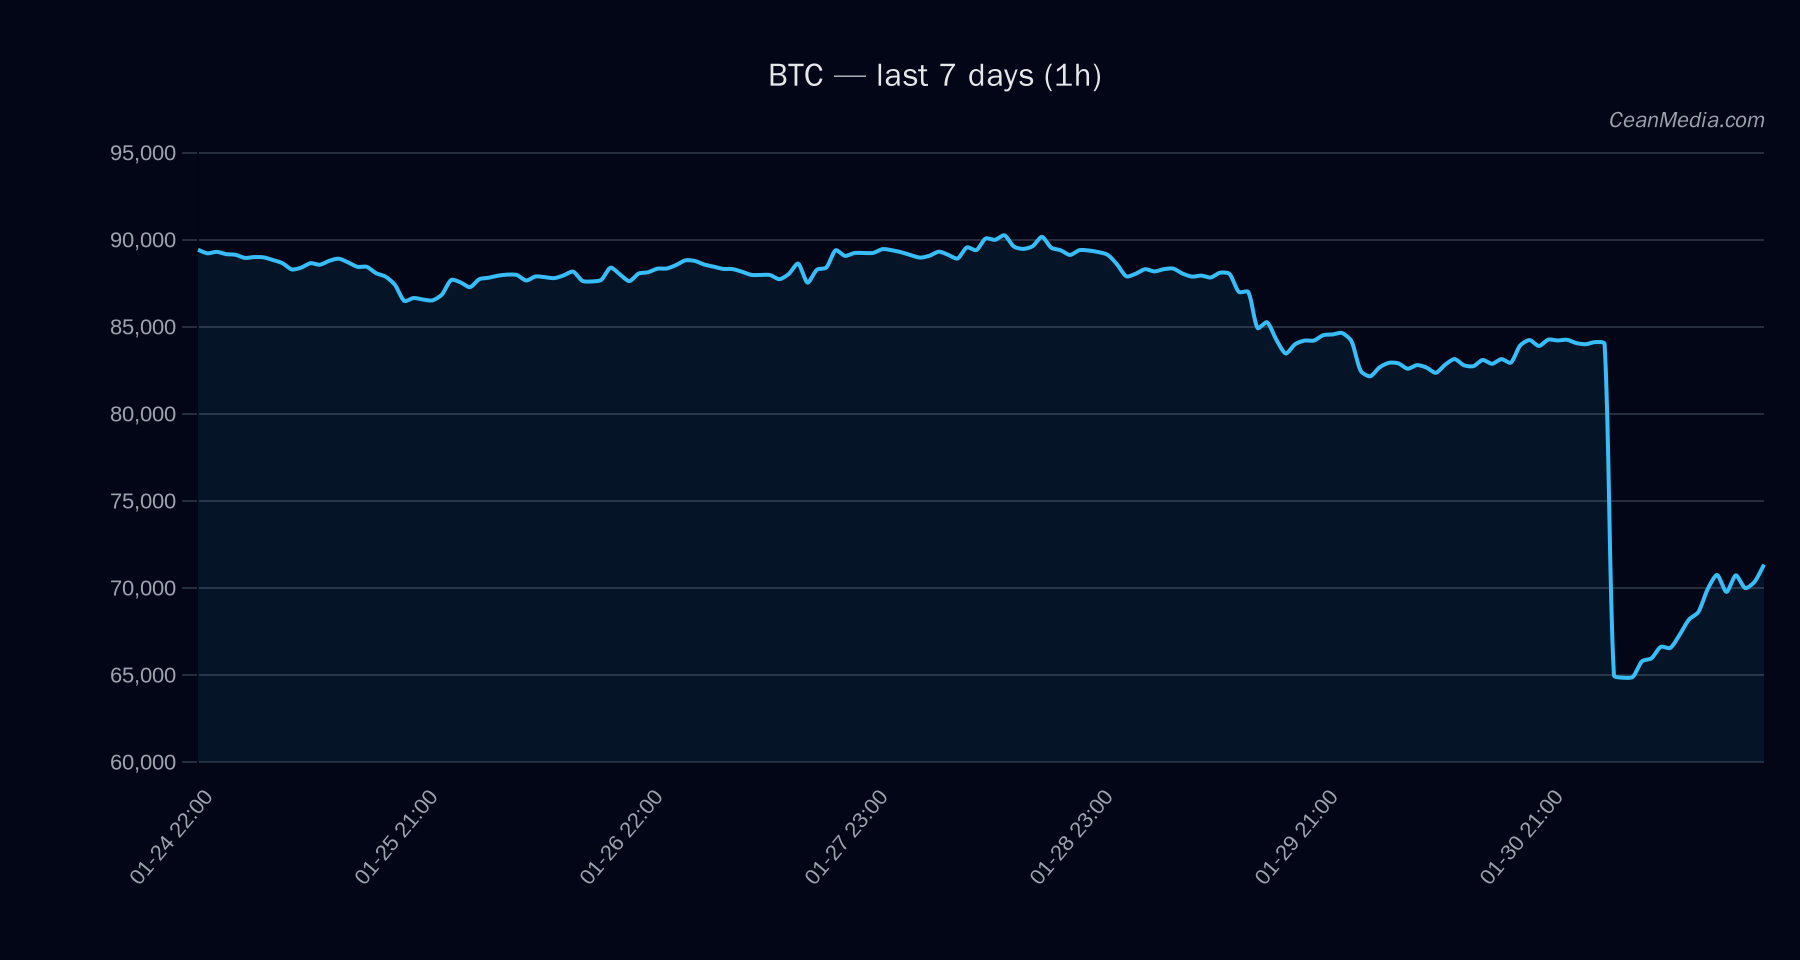
Market Snapshot
BTC trades in a defined range with support around 69,200 and resistance near 72,025. Current price is around 70,618.54. The near-term forecast indicates an up bias with a 42% probability, while downside risk remains evident given elevated volatility and a neutral RSI at 40. Key band projections suggest potential moves toward 73,471.53–74,912.15 on a breakout above 72,025, and downside targets of 67,822.05–66,437.92 on a break below 69,200.
- Support: Major 84,075; Near 69,200
- Resistance: Major 80,550; Near 72,025
- Upside breakpoint: 72,025 break targets 73,471.53–74,912.15
- Downside breakpoint: 69,200 break targets 67,822.05–66,437.92
Technical Analysis: BTC
Summary: BTC is characterized by EMA cross signals and elevated volatility. The EMA12 is below EMA26, and SMA50 is below SMA200, supporting a cautious bearish tilt in trend structure despite a short-term up forecast. RSI at 40 indicates neutral momentum. Volatility regime is elevated.
- Trend indicators: EMA12 < EMA26; SMA50 < SMA200
- Momentum: RSI 40 (neutral)
- Volatility: σ24h ≈ 4.66%, Vol regime: Elevated
- Forecast: Up 42% probability; other probabilities: Sideways ~24%; Down ~34%
- Key levels: Break above 72,025 targets 73,471.53–74,912.15; Break below 69,200 targets 67,822.05–66,437.92
Drivers
- EMA slope: +0.0004
- Funding Z-Score: -6.71
- Basis Z-Score: -4.20
- Order-book Imbalance (EMA5): 0.01
- Volatility regime: Elevated
- BTC Trend/Return signals are mixed; overall momentum not strongly bullish
ETF Flows (BTC/ETH)
Contextual note: ETF flow data is provided for BTC and ETH and is not a primary signal for BTC price action. It should be interpreted as additional market context regarding broader participation and potential liquidity shifts.
- BTC ETF: 1D −$434.1M; 5D −$1.03B; 10D −$1.67B
- ETH ETF: 1D −$77.9M; 5D −$312.6M; 10D −$337.8M
What to Watch Next
- Keep an eye on a close above 72,025 for a potential move toward 73,471.53–74,912.15.
- Watch for a break below 69,200 to open downside targets near 67,822.05–66,437.92.
- Monitor changes in volatility regime and EMA/MA cross signals for shifts in bias.
- Consider ETF flow signals as contextual, not primary, indicators for BTC price action.
Hashtags: #BTC #Bitcoin #MarketAnalysis #TechnicalAnalysis #ETFFlows #CryptoMarkets #TradingStrategy #Volatility #PriceAction #MarketContext #Liquidity