Market Snapshot
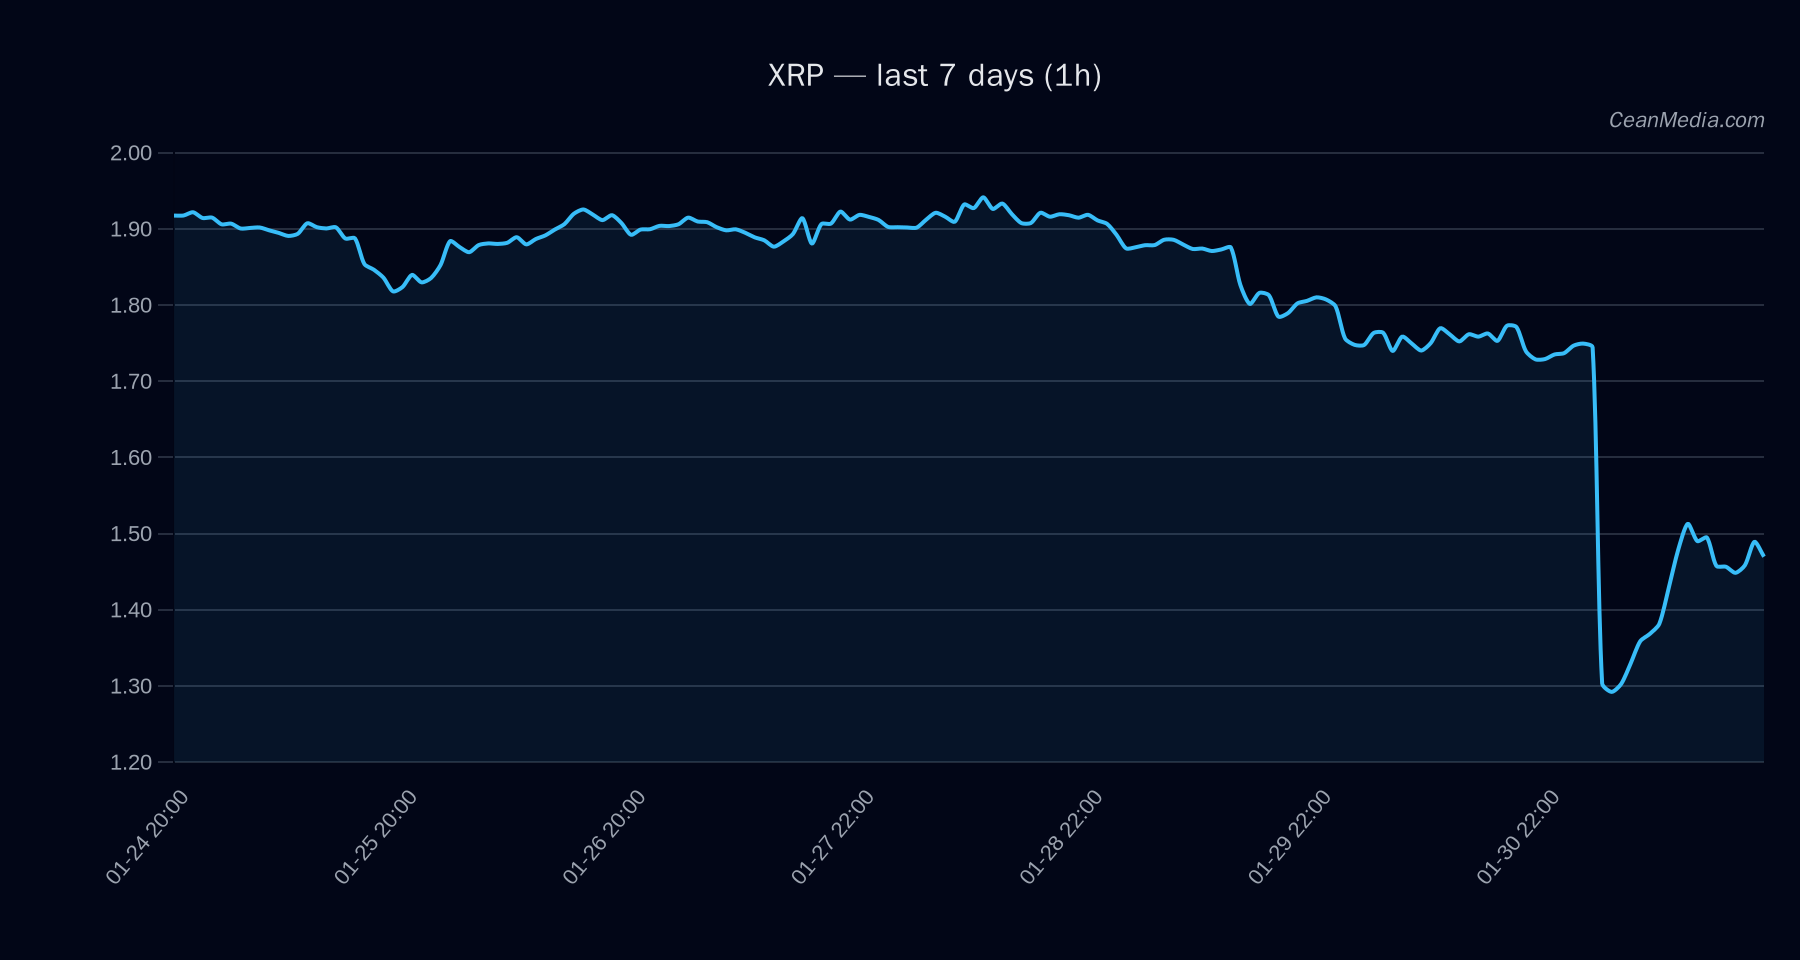
On 2026-02-07, XRP trades around the 1.46 area with near-term downside bias. The instrument remains between key support at 1.44 and resistance at 1.48. The broader market backdrop shows elevated volatility and a risk-off tone as indicated by sentiment gauges and cross-asset drivers.
Technical Analysis: XRP
- Current price: 1.4607
- Short-Term Forecast: Down (75%)
- Probabilities: Up 14%, Sideways 11%, Down 75%
- Key indicators: EMA12 < EMA26; SMA50 < SMA200; RSI 41; volatility regime: Elevated
- Support / Resistance: Major support 1.76 (near 1.44), Major resistance 1.82 (near 1.48)
- Band (P20–P80): 1.454 – 1.7411
- Near-term scenarios: Break above 1.48 → potential 1.5197–1.5547; Break below 1.44 → potential 1.4029–1.3679
- Bias: Bearish (RSI neutral, trend indicators weakly negative)
- Narrative: XRP sits within a tight range bounded by 1.44 and 1.48; downside risk remains elevated while upside potential is contingent on a clear break of resistance.
Drivers
- Top factors: EMA slope (-0.0001), Funding Z-score (-2.99), Basis Z-score (-2.55)
- Order-book Imbalance (EMA5): 0.07
- Volatility regime: Elevated
- BTC context: BTC volatility regime present; BTC trend strength not specified in current data
- Momentum signals: ρ(BTC,72h) 0.97 indicates high cross-asset correlation in recent window
- Fear/volatility: F&G (Crypto Fear & Greed index) at 6 (Extreme Fear)
ETF Flows (BTC/ETH)
Contextual note: ETF flow data provided here covers BTC and ETH only and is not a primary signal for XRP. It serves to illustrate broader market liquidity and risk appetite in the crypto ecosystem.
- BTC ETF: 1D -$434.1M | 5D -$1.03B | 10D -$1.67B
- ETH ETF: 1D -$77.9M | 5D -$312.6M | 10D -$337.8M
What to Watch Next
- Monitor the break of 1.48 for a potential move toward 1.5197–1.5547.
- Watch for a break below 1.44 to confirm a move toward 1.4029–1.3679.
- Stay attuned to volatility regime shifts and any changes in funding/basis z-scores which may signal flow-driven pressure.
- Consider cross-asset risk indicators (BTC volatility, correlation) for a broader market stance.
Hashtags: #XRP #CryptoAnalysis #TechnicalAnalysis #MarketSnapshot #ETFFlows #BTC #ETH #PriceAction #RiskOff #Volatility #Liquidity #CryptoMarkets