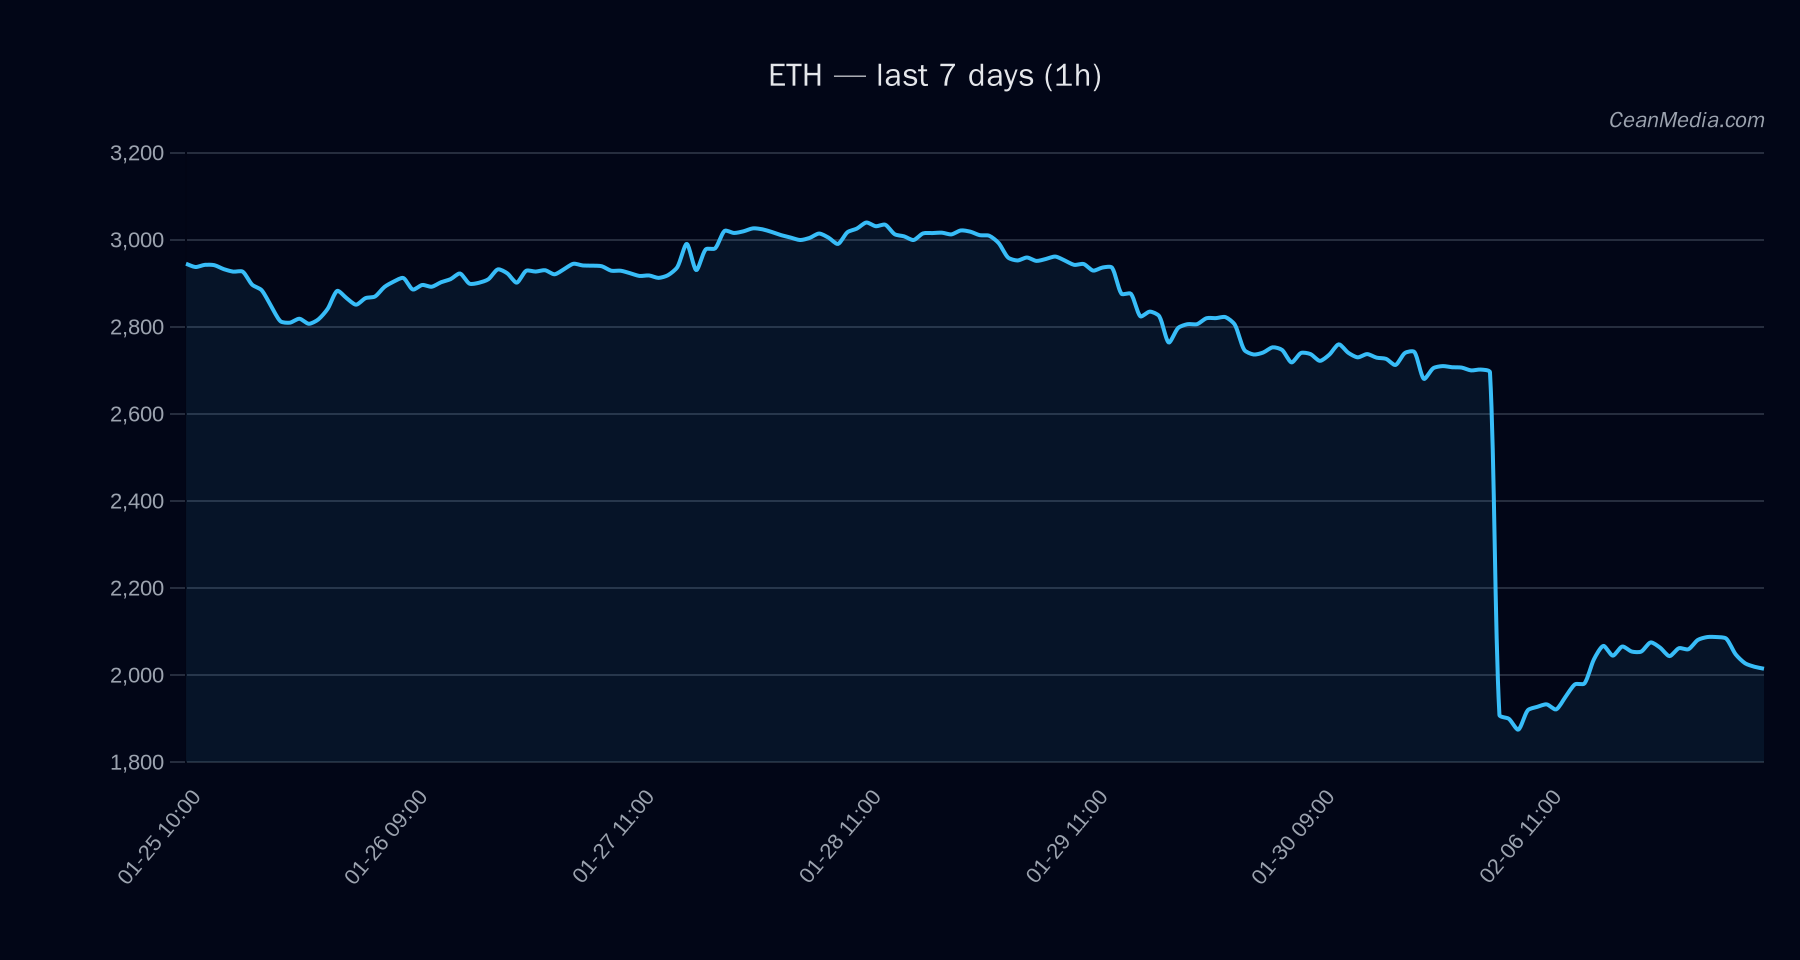
Market Snapshot
Ethereum (ETH) is trading around the 2,000 level, with the short-term bias skewed to downside based on current TA and market signals. The instrument sits between defined intraday support and resistance, with notable proximity to the major support at 1,996 and major resistance at 2,214. ETF flow context is provided for BTC and ETH to illustrate broader funding dynamics, but should be treated as contextual rather than a primary signal for ETH price action.
Technical Analysis: ETH
- Current price: 2,011.14
- Bias: Bearish/Down (short-term forecast 48% probability of continuation to the downside)
- Key indicators: EMA12 < EMA26, SMA50 < SMA200, RSI 32 (oversold), 24h volatility 1.03% (low volatility regime)
- Price targets and bands: P20–P80: 1,951.94 – 2,085.62; P50: 2,057.94
- Support / Resistance: Major Support 1,996; Near Support 1,970; Major Resistance 2,214; Near Resistance 2,052
- Forecast specifics: Break above 2,052 targets 2,092.39 – 2,133.42; Break below 1,970 targets 1,931.50 – 1,892.08
- Probability distribution (24h horizon): Up 42% | Sideways 9% | Down 48%
- Contextual notes: Breadth>50h: 0%, BTC correlation 72h: 0.99, Vol regime: Low, F&G fear index (extreme fear) noted, ETH ETF 5D flow: -38.7M
Drivers
- Return 24H: 0.05 (modest one-day gain)
- EMA Slope: -0.003 (negative slope indicates bearish momentum)
- Funding Z-Score: -0.53
- Basis Z-Score: -0.47
- Order-book Imbalance (EMA5): 0.27 (slight buying pressure on short horizon)
- BTC Return 24H: 0.04
- BTC Vol Regime: 1 (elevated/volatile context but currently low within crypto breadth)
- BTC Trend Strength: 0.69 (moderate trend momentum in BTC, influences ETH through cross-asset dynamics)
ETF Flows (BTC/ETH)
ETF flow data is provided for BTC/ETH to supply a contextual backdrop of broader market participation. ETF data is not a primary signal for ETH at this time. BTC ETF flows show +$92.1M in 1D with negative 5D and 10D flows; ETH ETF flows show +$9.7M in 1D with negative longer-dated flows. The net effect suggests modest near-term liquidity support in BTC with lighter one-day participation in ETH, contributing to overall market risk-on/off sentiment but not a direct ETH price driver.
What to Watch Next
- Watch for a break above 2,052 to confirm potential near-term upside toward 2,092–2,133.
- Monitor a break below 1,970 for potential move toward 1,892–1,931 range.
- Keep an eye on the EMA12/EMA26 relationship and SMA50/SMA200 cross dynamics as leading momentum signals evolve.
- Assess BTC price action and BTC volatility context as corroborating signals for ETH moves, given high 72h correlation.
Hashtags: #ETHTechnical #ETHAnalysis #ETFFlows #BTC #MarketSnapshot #TechnicalAnalysis #CryptoNews #CryptoMarkets #TradingStrategy #Liquidity #PricePrediction