Market Snapshot
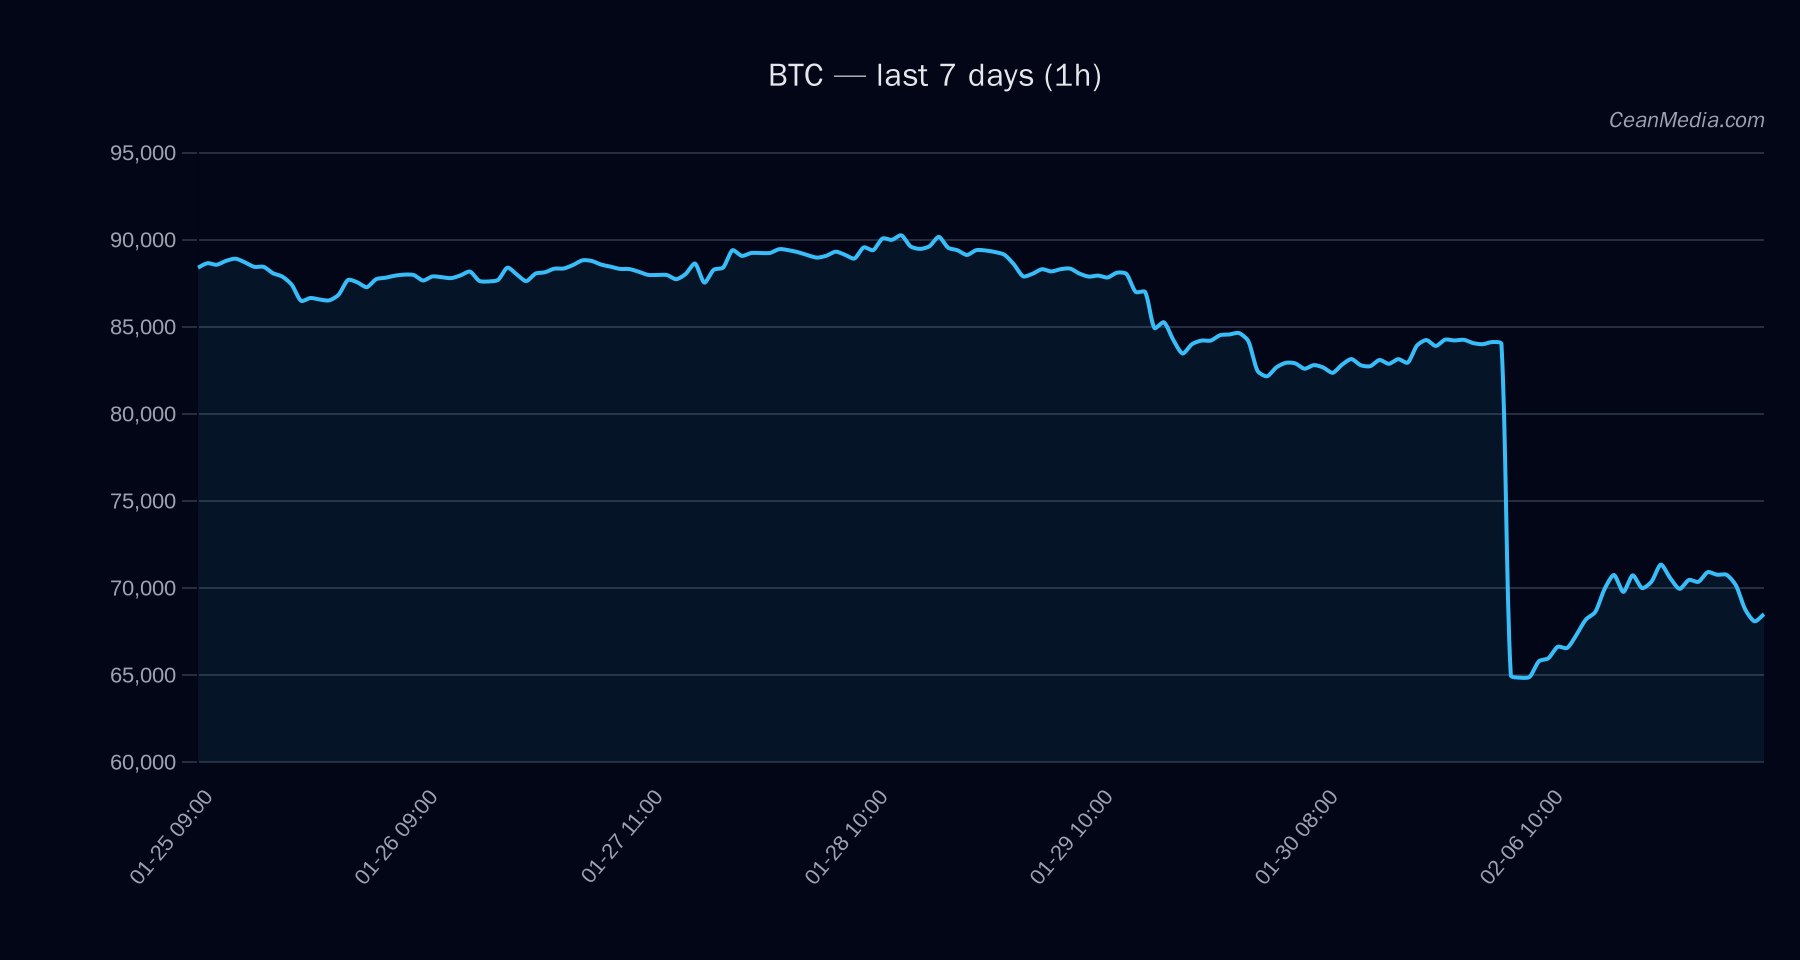
BTC sits within a defined range with key support and resistance. The price is around 67,997, with near-term dynamic targets influenced by recent momentum and volatility patterns. ETF flow context is provided for BTC and ETH, but should be treated as contextual rather than primary trading signals for BTC.
Technical Analysis: BTC
Support major 82,950; near 66,625. Resistance major 77,150; near 69,350. Price is currently between 66,625 and 69,350. Forecast: up with 42% probability for the next 24 hours. Overall TA shows bearish indicators on traditional crossovers: EMA12 Break > 69,350 targets 70,744.05–72,131.19. Break < 66,625 targets 65,304.29–63,971.55. P50 around 73,435.86; Band (P20–P80) 67,564.96 to 73,797.35. Vol regime: Low; BTC trend strength around 1.06; funding and basis z-scores negative, indicating cautious positioning. A move through key levels with a confirmation is needed to shift bias; a sustained close above 69,350 would imply upside continuation, while a break below 66,625 would increase downside risk.
Drivers
- Return over 24h: +0.06%
- EMA slope: negative (-0.003)
- Funding z-score: -3.69 (deleveraging/negative funding sentiment)
- Basis z-score: -1.18
- Order-book imbalance (EMA5): +0.18
- BTC 24h return: +0.06%
- BTC vol regime: Low
- BTC trend strength: ~1.06
ETF Flows (BTC/ETH)
- BTC ETF: 1D +$92.1M | 5D -$425.7M | 10D -$1.48B
- ETH ETF: 1D +$9.7M | 5D -$38.7M | 10D -$286.4M
Interpretation: ETF data shown are BTC and ETH only and are provided as contextual information. ETF flows are not treated as primary BTC signals; they can reflect broader risk sentiment but should be weighed alongside price action, on-chain signals, and macro factors.
What to Watch Next
- Monitor for a close above 69,350 to confirm near-term upside potential toward 70,744–72,131.
- Watch for a break below 66,625 to assess downside risk toward 65,304–63,972.
- Assess changes in volatility regime and funding/basis z-scores for shifts in market sentiment.
- Consider ETF flow context as a secondary signal, remaining aligned with price action and on-chain indicators.
Hashtags: #Bitcoin #BTCAnalysis #MarketStatus #ETFFlows #TechnicalAnalysis #CryptoMarkets #PriceAction #TradingStrategies #CryptoNews #BTCForecast #MarketSentiment