Market Snapshot
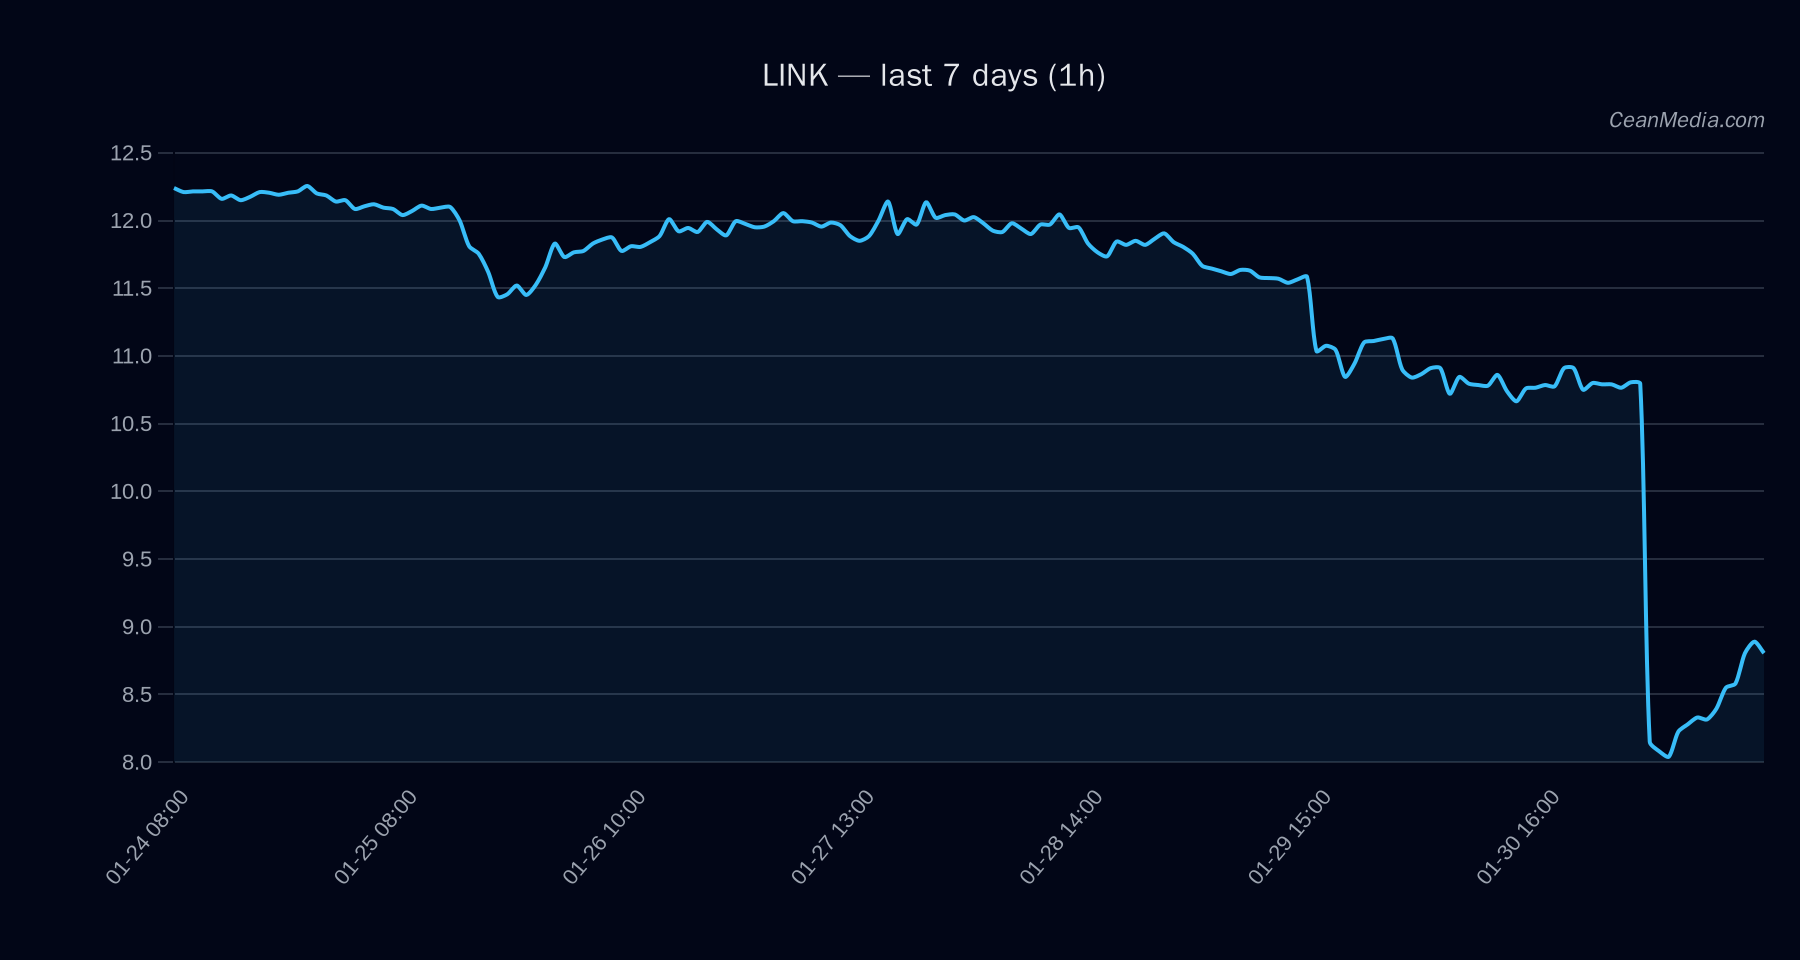
Primary asset: LINK. Latest intraday readings position near-term risk to the downside with a bearish tilt in the short horizon. Price is trading around 8.8, with key support near 8.66 and resistance approaching 9.0–9.0+ after a probe of the 9 level. Overall market breadth indicators suggest a cautious stance as volatility remains elevated.
Technical Analysis: LINK
: - Near-term Support: 8.66 (major nearby)
- Major Support: 10.8 (reference point)
- Near-term Resistance: 9.00 (close to current)
- Major Resistance: 12.5
: EMA12 < EMA26; SMA50 < SMA200; RSI at 35 (bearish/oversold area). : 54.5% probability of downward move over the next 24 hours; probabilities: Up 34%, Sideways 11%, Down 54%. : - Upside trigger: 1h close > 9.0 → potential moves toward 9.19–9.58.
- Downside trigger: 1h close < 8.66 → potential moves toward 8.48–8.08.
Drivers
- EMA slope: -0.00035 (slightly negative trajectory)
- Funding Z-score: -0.149
- Basis Z-score: -0.970
- Order-book imbalance (EMA5): 0.108
- BTC volatility regime: 1 (elevated)
- Volatility of volatility (VoV): 0.010
- Distance from moving averages: -0.179 (below recent averages)
- Drawdown 30d: -38.36%
ETF Flows (BTC/ETH)
Contextual market backdrop from BTC/ETH ETF flows indicates risk-off or risk-on sentiment, but these signals should be interpreted as context rather than a primary driver for LINK. The data presented below reflects BTC and ETH ETF flows rather than LINK-specific instruments.
- BTC ETF: 1D -$434.1M | 5D -$1.03B | 10D -$1.67B
- ETH ETF: 1D -$77.9M | 5D -$312.6M | 10D -$337.8M
Interpretation: Large net outflows in BTC ETFs can signal a broader risk-off tone or rotation into other assets. These flows should be viewed as a macro-context indicator rather than a direct signal for LINK movements, given LINK’s idiosyncratic factors and altcoin risk profile.
What to Watch Next
- Watch for a daily close above 9.00 to validate a potential upside setup toward 9.19–9.58.
- Monitor 8.66 as a near-term critical support; a break below could accelerate a move toward 8.48–8.08.
- Keep an eye on volatility regime and RSI trends around 35–40 for potential bottoming signals.
- Reassess if BTC ETF flows shift from negative to neutral/positive, as broader market risk appetite can influence altcoins.
Hashtags: #LINK #CryptoTrading #TechnicalAnalysis #ETFFlows #MarketSnapshot #Altcoins #PriceAction #RSI #EMA #SMA