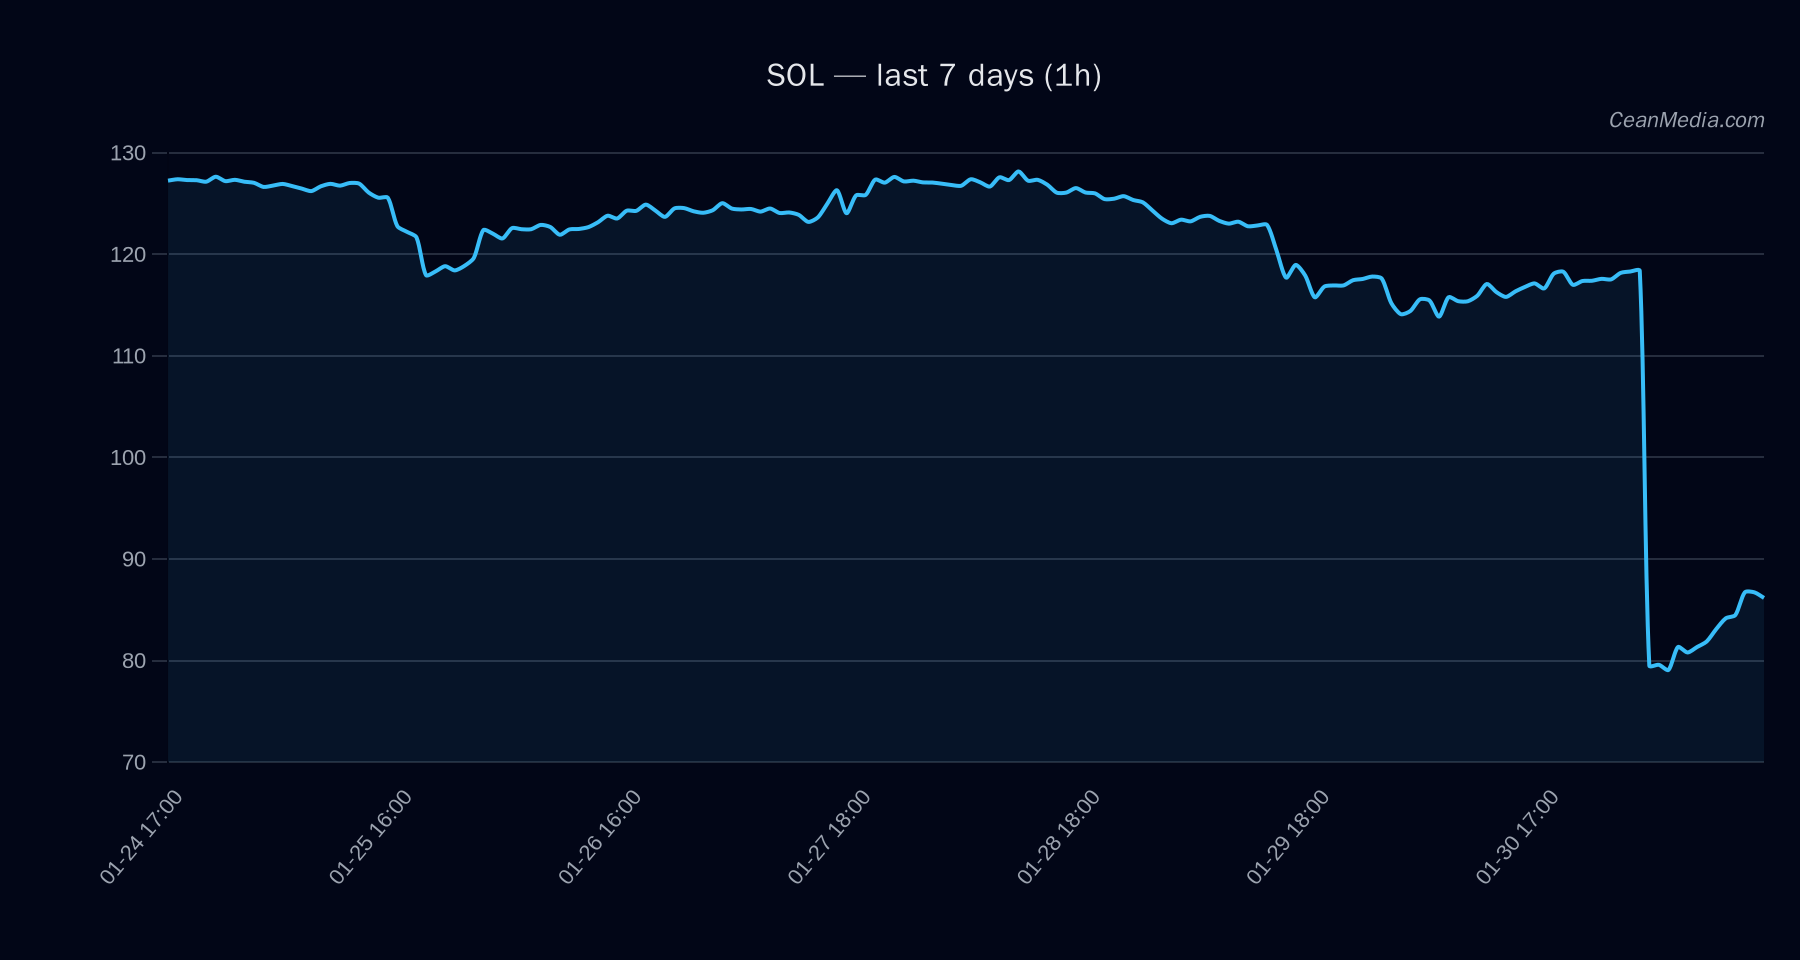
Market Snapshot
Solana (SOL) trades around the mid-80s zone with near-term resistance approaching 88.5 and major resistance around 125. The current setup shows oversold conditions on the RSI (29) with elevated volatility and bearish market breadth signals. An up-move is plausible on a sustained break above key near-term resistance, while a break below 85 would open downside targets toward the 78–83 range.
Technical Analysis: SOL
- 86.76 (from 2026-02-06 snapshot)
- Up (probability 50% in 24h horizon)
-
- Near-term Support: 85
- Major Support: 86.8
- Near-term Resistance: 88.5
- Major Resistance: 125
- Patterns / Signals: EMA12 < EMA26, SMA50 < SMA200 indicate bearish cross; RSI at 29 indicates oversold; Volatility regime: Elevated
- Upside / Downside Triggers:
- Upside Trigger: 1h close > 88.5 → potential path to 90.27–95.45
- Downside Trigger: 1h close < 85 → potential path to 83.32–78.14
- Invalidation / Caution: The breadth context is weak (Breadth>50h: 0%), and momentum signals are negative (EMA slope negative, funding/basis Z-scores deeply negative). A sustained move above 88.5 would be needed to shift the near-term bias toward a more constructive setup.
Drivers
- Top factors include negative EMA slope (-0.0038) and negative funding and basis z-scores (-7.29, -6.69), signaling renewed selling pressure.
- Order-book imbalance (EMA5) small positive (≈0.02) but not sufficiently supportive by itself.
- Vol regime: Elevated; volatility of the last 24h remains a key characteristic in positioning risk for SOL.
- BTC-related context indicates a risk-off backdrop in related markets, though BTC data is not actionable for SOL in isolation.
ETF Flows (BTC/ETH)
ETF flow data provided pertains only to BTC and ETH. BTC ETF flows show large negative values (1D: −$434.1M; 5D: −$1.03B; 10D: −$1.67B). ETH ETF flows are also negative (1D: −$77.9M; 5D: −$312.6M; 10D: −$337.8M). This context indicates a risk-off sentiment and a house liquidity tilt away from BTC/ETH ETFs in the observed windows. It is important to note that ETF flows are context data for market mood and macro funding conditions; they are not primary signals for SOL price action.
What to Watch Next
- Monitor for a daily close above 88.5 to validate upside momentum toward 90.3–95.4.
- If SOL breaks below 85 on high volume, anticipate a move toward 83.3–78.1.
- Watch momentum indicators and breadth signals for any shift from current bearish tilt to confirmive trend development.
- Consider how BTC/ETH ETF flows and macro risk appetite evolve, as they provide contextual backdrop but should not be treated as SOL-specific signals.
Hashtags: #Solana #SOL #Cryptocurrency #TechnicalAnalysis #ETFFlows #MarketUpdate #CryptoMarkets #CryptoTrading #PriceAction #Liquidity #Altcoins