Market Snapshot
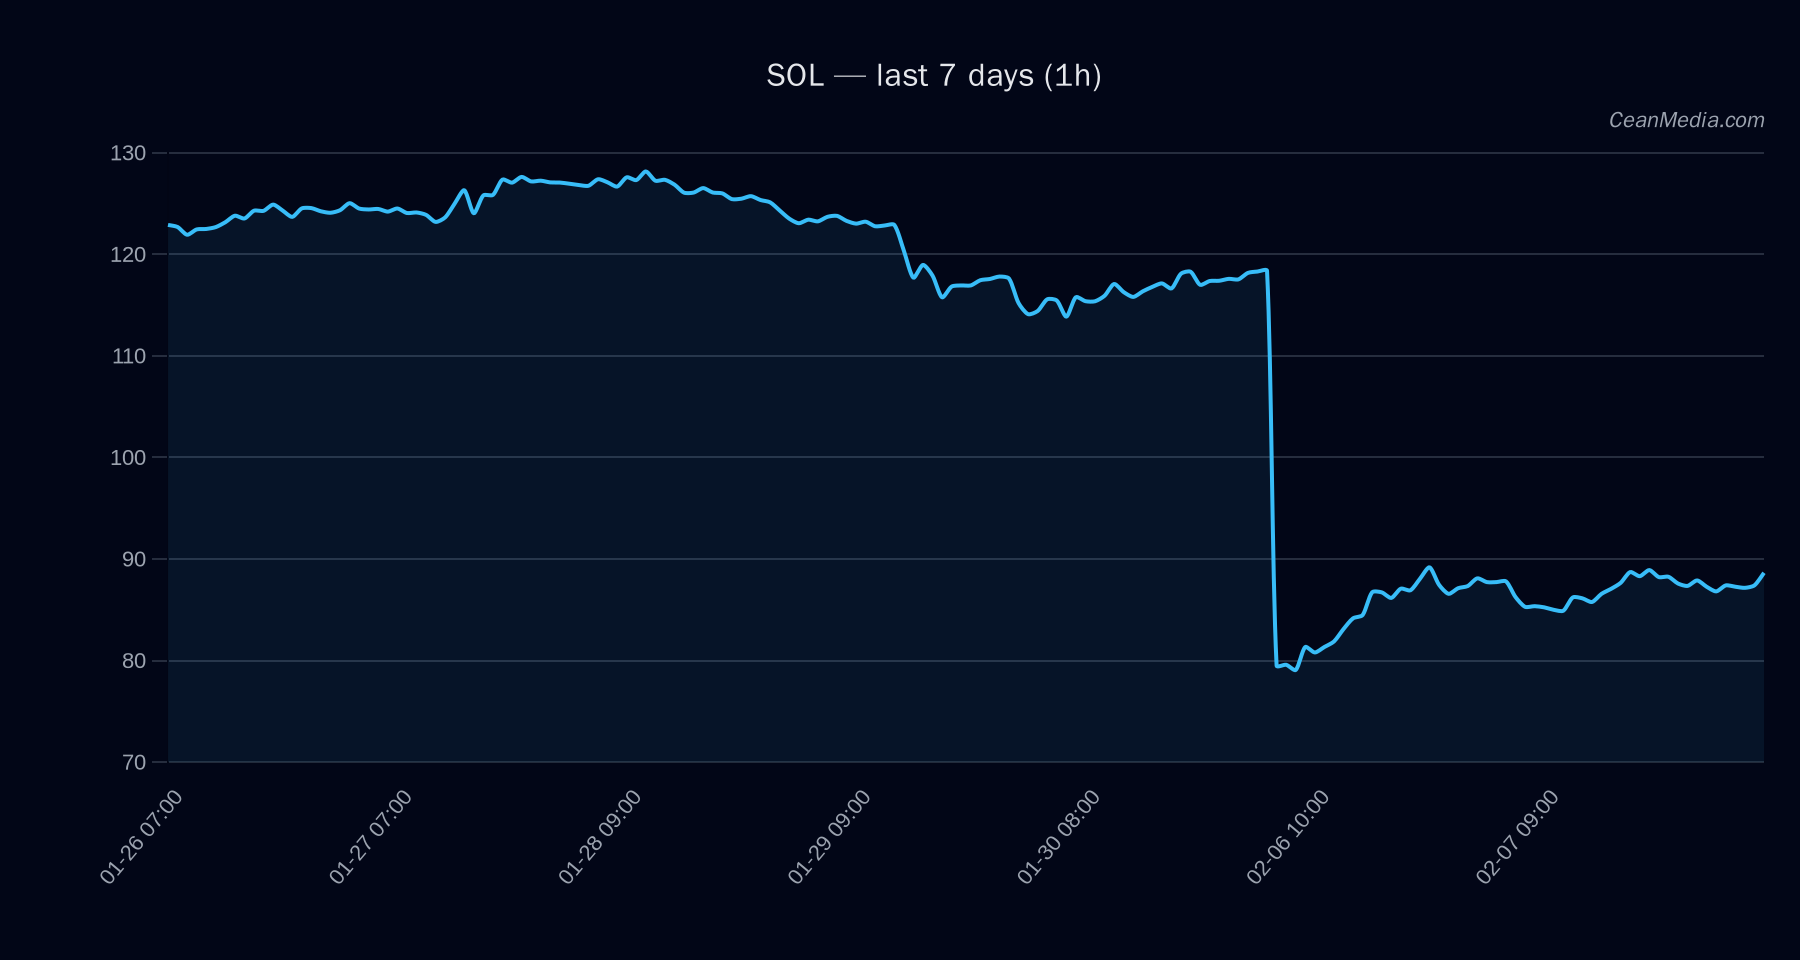
Solana (SOL) trades near a defined support/resistance band with a near-term bullish bias implied by a 60% probability of an upside move. The current price sits around the mid-point of the analyzed range, with low intraday volatility and a neutral RSI reading. Overall context includes broad crypto breadth strength and a mixed BTC/ETH ETF flow backdrop.
Technical Analysis: SOL
- Price / Levels: Price 87.72; Major support at 86.6 with near-term 86.0; Major resistance at 93.8 with near-term 89.5.
- Forecast & Bias: Short-term forecast: up (60%). Forecast probability: up 60%, sideways 8.7%, down 31.1%.
- Momentum Indicators: EMA12 < EMA26; SMA50 < SMA200; RSI 49 (neutral). Volatility regime: Very low; σ24h 0.62%.
- Key Targets: Upside if 1h close > 89.5 → potential path to 91.26–93.05. Break below 86 → potential path to 84.25–82.53.
- Band / Range: P20–P80 86.97 – 92.10; P50 (median) 89.70; P80 92.10.
- Intra-Trade Signals: RSI neutral; price currently oscillating within the defined support/resistance, with no aggressive breakout signals flagged.
- Invalidation / Risk Controls: A break below 86 would shift the near-term bias toward the 84.25–82.53 region; a break above 93.8 would open next resistance in the 95–97 area depending on momentum.
Drivers
- Return 24H: 0.04
- EMA Slope: 0.0022
- Funding Z-Score: -4.46
- Basis Z-Score: -3.80
- Order-Book Imbalance (EMA5): -0.04
- BTC Return 24H: 0.03
- BTC Vol Regime: 0
- BTC Trend Strength: 1.20
Contextual momentum indicators suggest momentum is modest with non-extreme risk sentiments. Cross-asset signals show BTC strength near-term supports a cautious constructive view for SOL, while leveraged funding signals remain negative, highlighting a nuanced risk environment.
ETF Flows (BTC/ETH)
Note: ETF data presented here pertains to BTC and ETH only and is provided for contextual market backdrop. This data is not a primary signal for SOL price action.
- BTC ETF: +$330.7M (1D); -$187.1M (5D); -$1.24B (10D)
- ETH ETF: -$33.2M (1D); -$81.6M (5D); -$329.3M (10D)
The BTC ETF flow shows near-term inflows on a daily basis but persistent mid-term outflows, while ETH ETF flows are negative across all observed horizons. Overall, this profile suggests a cautious risk-on/off backdrop and should be interpreted as context rather than a SOL-specific signal.
What to Watch Next
- Watch for a decisive close above 89.5 to validate the upside path toward 91.26–93.05.
- Monitor a break below 86 for confirmation of a potential pullback to 84.25–82.53.
- Observe changes in BTC/ETH ETF flows as a supplementary risk-on/risk-off indicator.
- Maintain awareness of volatility regime; with very low volatility, small catalysts could trigger outsized moves.
Hashtags: #Solana #SOL #CryptoMarkets #TechnicalAnalysis #ETFFlows #BTC #ETH #MarketSnapshot