Market Snapshot
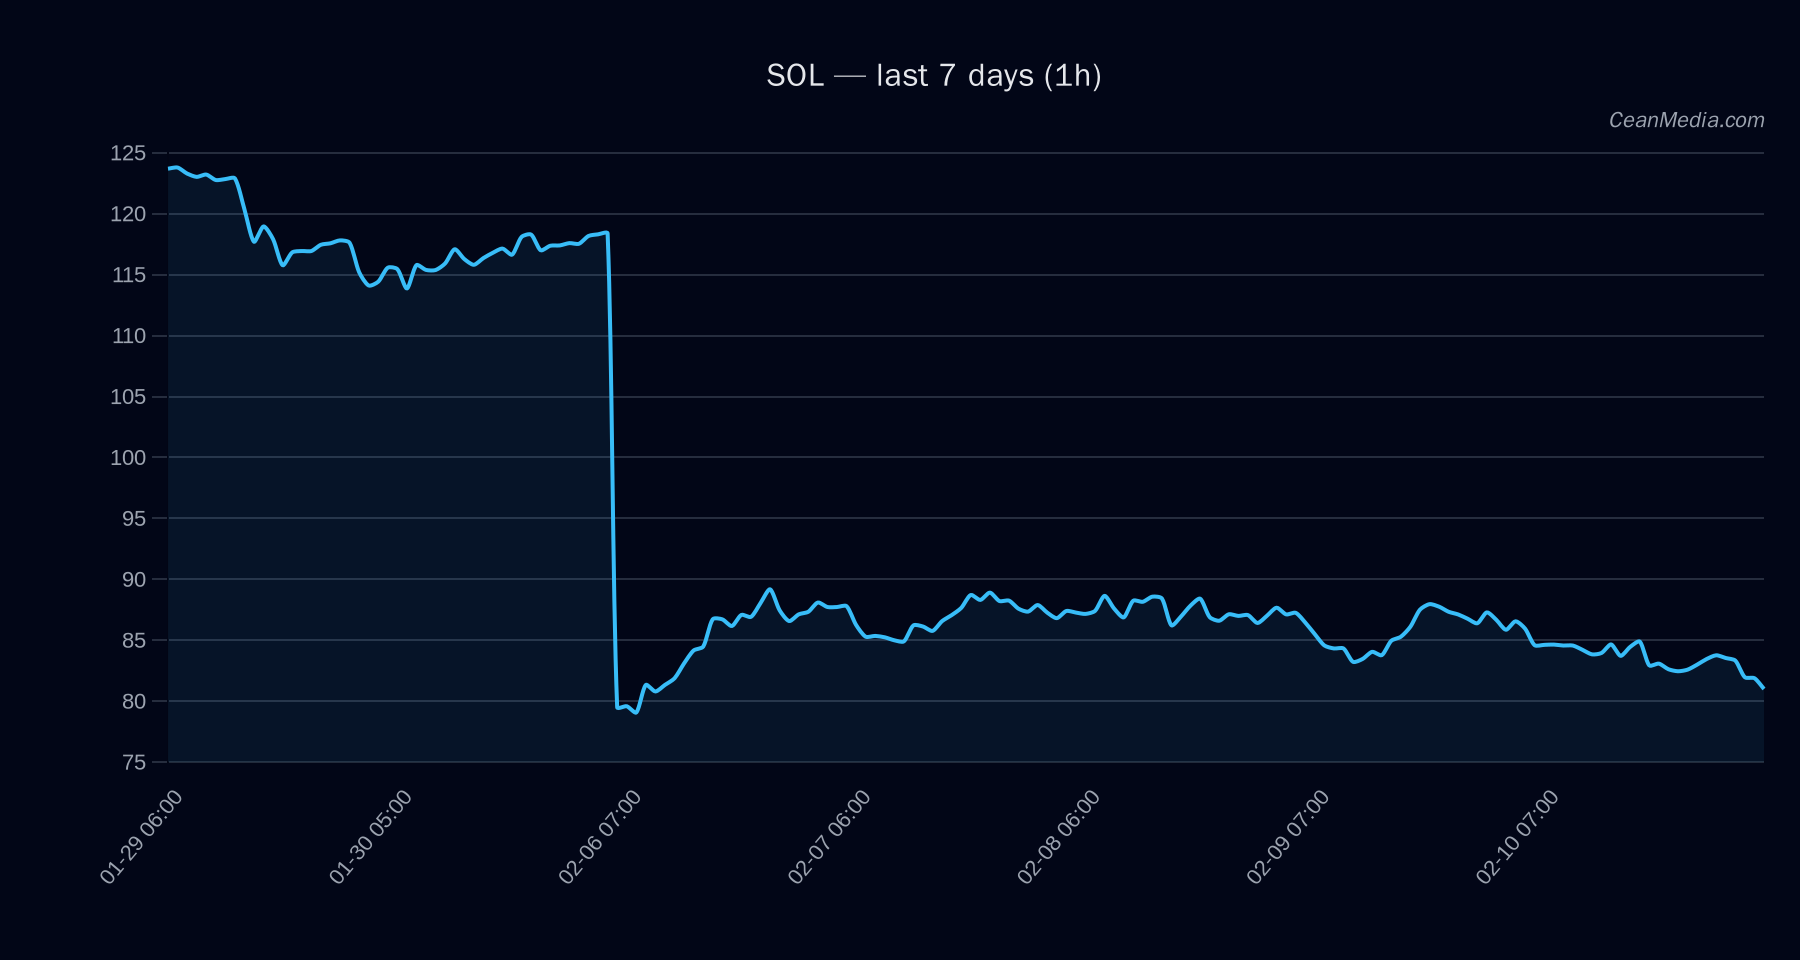
Solana (SOL) is trading around the mid-80s, with a short-term bias skewed toward a continued up move underpinned by a narrow price range between key supports and resistances. Current conditions show a bearish TA backdrop despite a forecasted upside momentum, reflecting low volatility and subdued breadth.
Technical Analysis: SOL
- Price: 80.98
- Short-Term Forecast: Up (49%)
- Supports / Resistances: Major Support at 83, Near Support 79.4; Major Resistance at 88.8, Near Resistance 82.6
- Key Levels for Next Move: Upside trigger if 1h close > 82.6 (target 84.25–85.90); Downside trigger if 1h close < 79.4 (target 77.77–76.19)
- Technical Alignment: EMA12 < EMA26, SMA50 < SMA200 (bearish trend); RSI 31 (oversold)
- Volatility Regime: Very low (σ24h ≈ 0.79%)
- Forecast Interpretation: Up in 24h horizon, but overall TA remains bearish on structure due to long-term moving average alignment; RSI remains neutral to oversold suggesting limited upside momentum without a clear breakout.
Drivers
- Top factors include: Return 24h (-0.04), EMA slope (-0.0044), Funding Z-Score (0.02), Basis Z-Score (0.23), Order-Book Imbalance via EMA5 (0.03), BTC Return 24h (-0.03)
- BTC-specific indicators show weak negative price action and flat vol regime, with BTC trend strength high (0.92), indicating some market breadth support.
- Overall breadth indicators show limited participation (Breadth>50h: 0%), and volatility regime remains very low, implying a cautious market environment.
ETF Flows (BTC/ETH)
The ETF data provided pertains to BTC and ETH rather than SOL. The latest reported figures show:
- BTC ETF: 1D +$140.0M, 5D +$71.3M, 10D -$856.0M
- ETH ETF: 1D +$22.2M, 5D -$9.5M, 10D -$317.3M
Context: ETF flows are a market context signal and can influence risk sentiment, but they are not the primary signal for SOL. This data should be interpreted as a sentiment overlay and not a direct driver for SOL pricing decisions.
What to Watch Next
- Close above 82.6 to validate upside continuation toward 84.25–85.90 in the near term.
- Break below 79.4 to shift focus to 77.77–76.19, potentially triggering a deeper pullback.
- Monitor EMA12/EMA26 crossover dynamics for any shift in mid-term trend direction.
- Keep an eye on BTC-driven risk sentiment, given correlated dynamics and the current ETF flow backdrop.
Hashtags: #SOL #crypto #Solana #trading #technicalanalysis #ETFFlows #BTC #ETH #marketdata #macro #riskmanagement