Market Snapshot
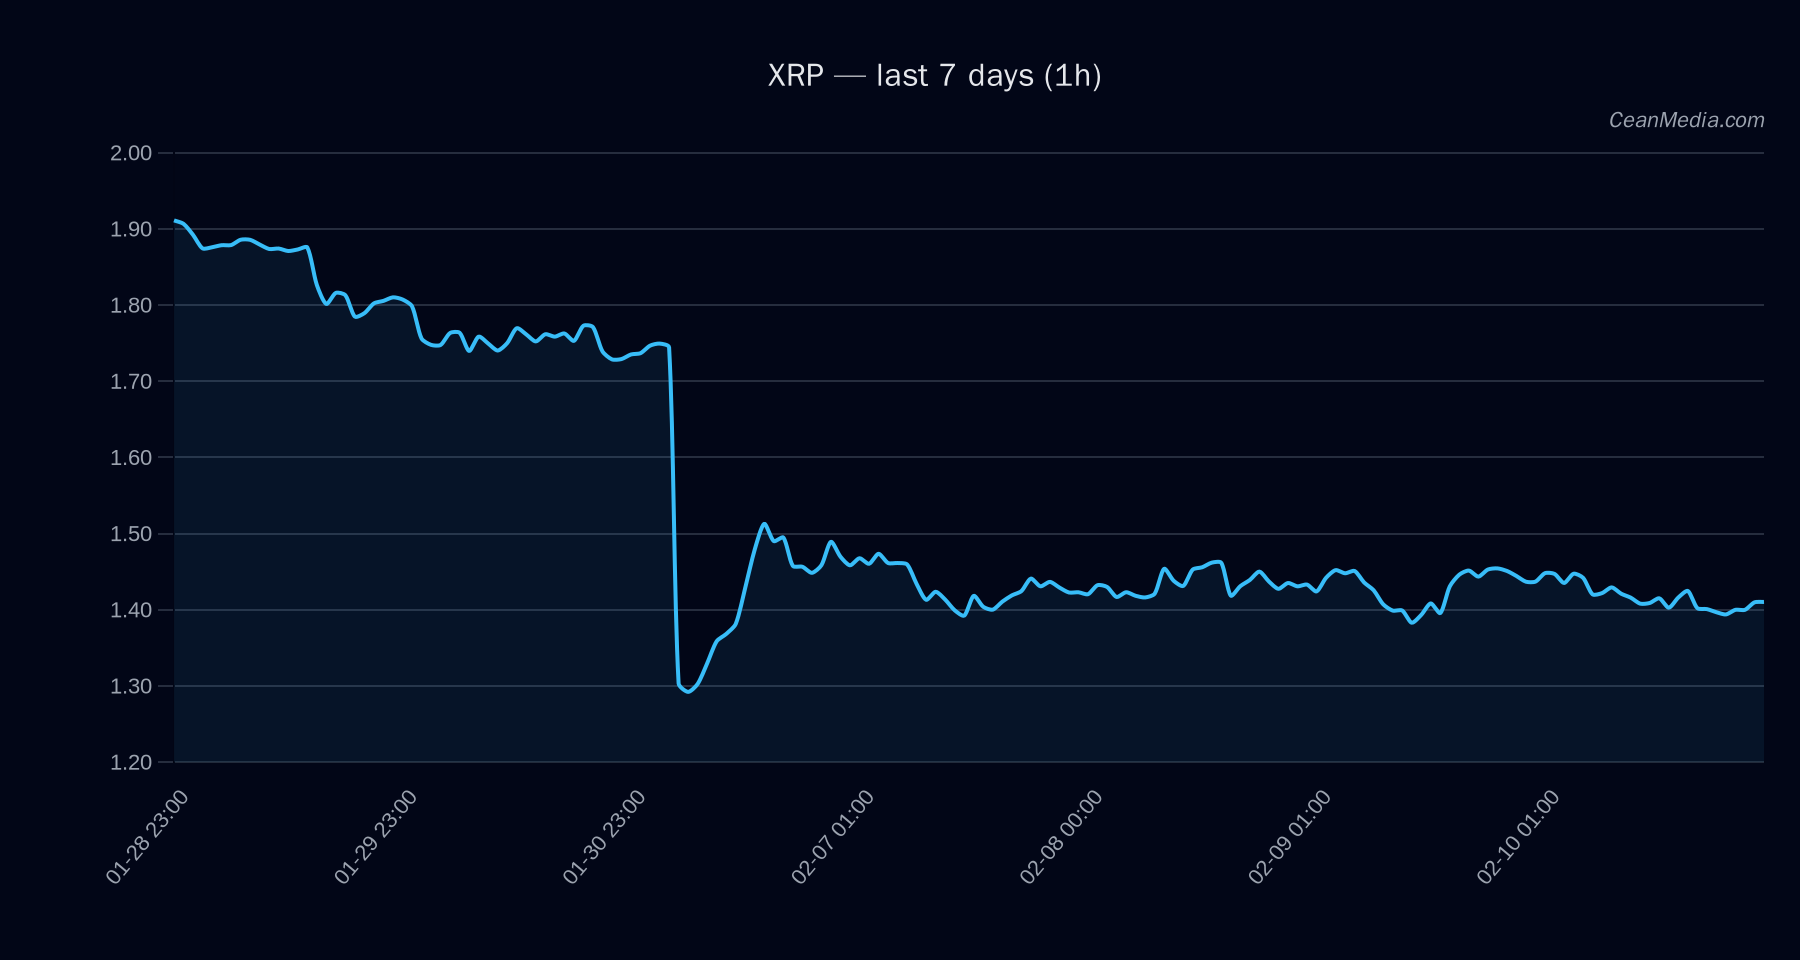
Current price for XRP: 1.3958. The token sits between key levels: major support at 1.42 and near-term support at 1.36, with major resistance at 1.52 and near-term resistance at 1.42. The immediate technical bias is bearish/sideways with a short-term forecast leaning down (50%). The volatility regime is described as Very low, and the RSI stands at 41, indicating ongoing bearish momentum but not currently oversold.
Key bands and targets:
- Band (P20–P80): 1.3715 – 1.4575
- Upside trigger: a 1h close above 1.42 could push toward 1.4522 – 1.4807
- Downside trigger: a 1h close below 1.36 could pull toward 1.3405 – 1.3132
Technical Analysis: XRP
Current structure: RSI 41, EMA12 < EMA26, SMA50 < SMA200, Vol regime: Very low. The trend indicators point to a bearish setup with limited momentum, awaiting a breakout beyond defined bands to confirm a directional shift.
Levels to watch:
- Support: Major 1.42; Near 1.36
- Resistance: Major 1.52; Near 1.42
- Near-term bias: Downward with a 50% forecast probability; alternative scenario remains sideways if price consolidates near current range
Bias and triggers:
- Bias: Bearish / Neutral as price trades within a narrow range around 1.40
- Upside trigger: 1h close > 1.42 to open potential move toward 1.4522–1.4807
- Invalidation: 1h close < 1.36 weakens the case and targets 1.3405–1.3132
Drivers
- RETURN 24H: -0.03
- EMA SLOPE: 0.0004
- FUNDING Z-SCORE: -1.99
- BASIS Z-SCORE: -0.97
- ORDER-BOOK IMBALANCE (EMA5): -0.11
- BTC RETURN 24H: -0.02
- BTC VOL REGIME: 0
- BTC TREND STRENGTH: 0.73
Contextual breadth metrics show breadth under 50h, with volatility regime described as very low. Overall momentum indicators reflect a cautious setup with potential for a breakout given a shift in intraday dynamics.
ETF Flows (BTC/ETH)
Contextual note: ETF flow data is presented for BTC and ETH and is not a primary signal for XRP. It provides macro-market context regarding risk appetite, liquidity, and potential correlation drivers for the broader crypto market.
- BTC ETF: +$165.8M (1D); -$400.7M (5D); -$1.04B (10D)
- ETH ETF: +$102.0M (1D); -$59.7M (5D); -$342.2M (10D)
Interpretation: The one-day BTC/ETH ETF flows show a mixed or modestly bullish tilt on the short horizon, but the longer-term flows have been negative. This pattern may reflect risk-off tendencies or shifting liquidity across crypto assets. These ETF signals should be viewed as contextual rather than actionable signals for XRP trading decisions.
What to Watch Next
- Monitor for a 1h close above 1.42 to validate upside continuation toward 1.4522–1.4807.
- Watch for a 1h close below 1.36 to confirm renewed downside momentum toward 1.3405–1.3132.
- Assess changes in RSI momentum and volume regime if price breaks the current range to identify potential regime shifts.
- Keep an eye on BTC/ETH ETF flow trends as a broader market risk signal, recognizing they are contextual rather than XRP-specific signals.
Hashtags: #XRP #CryptoAnalysis #TechnicalAnalysis #MarketSnapshot #ETFFlows #Bitcoin #Ether #BTC #ETH #Liquidity #RiskOn #RiskOff