Market Snapshot
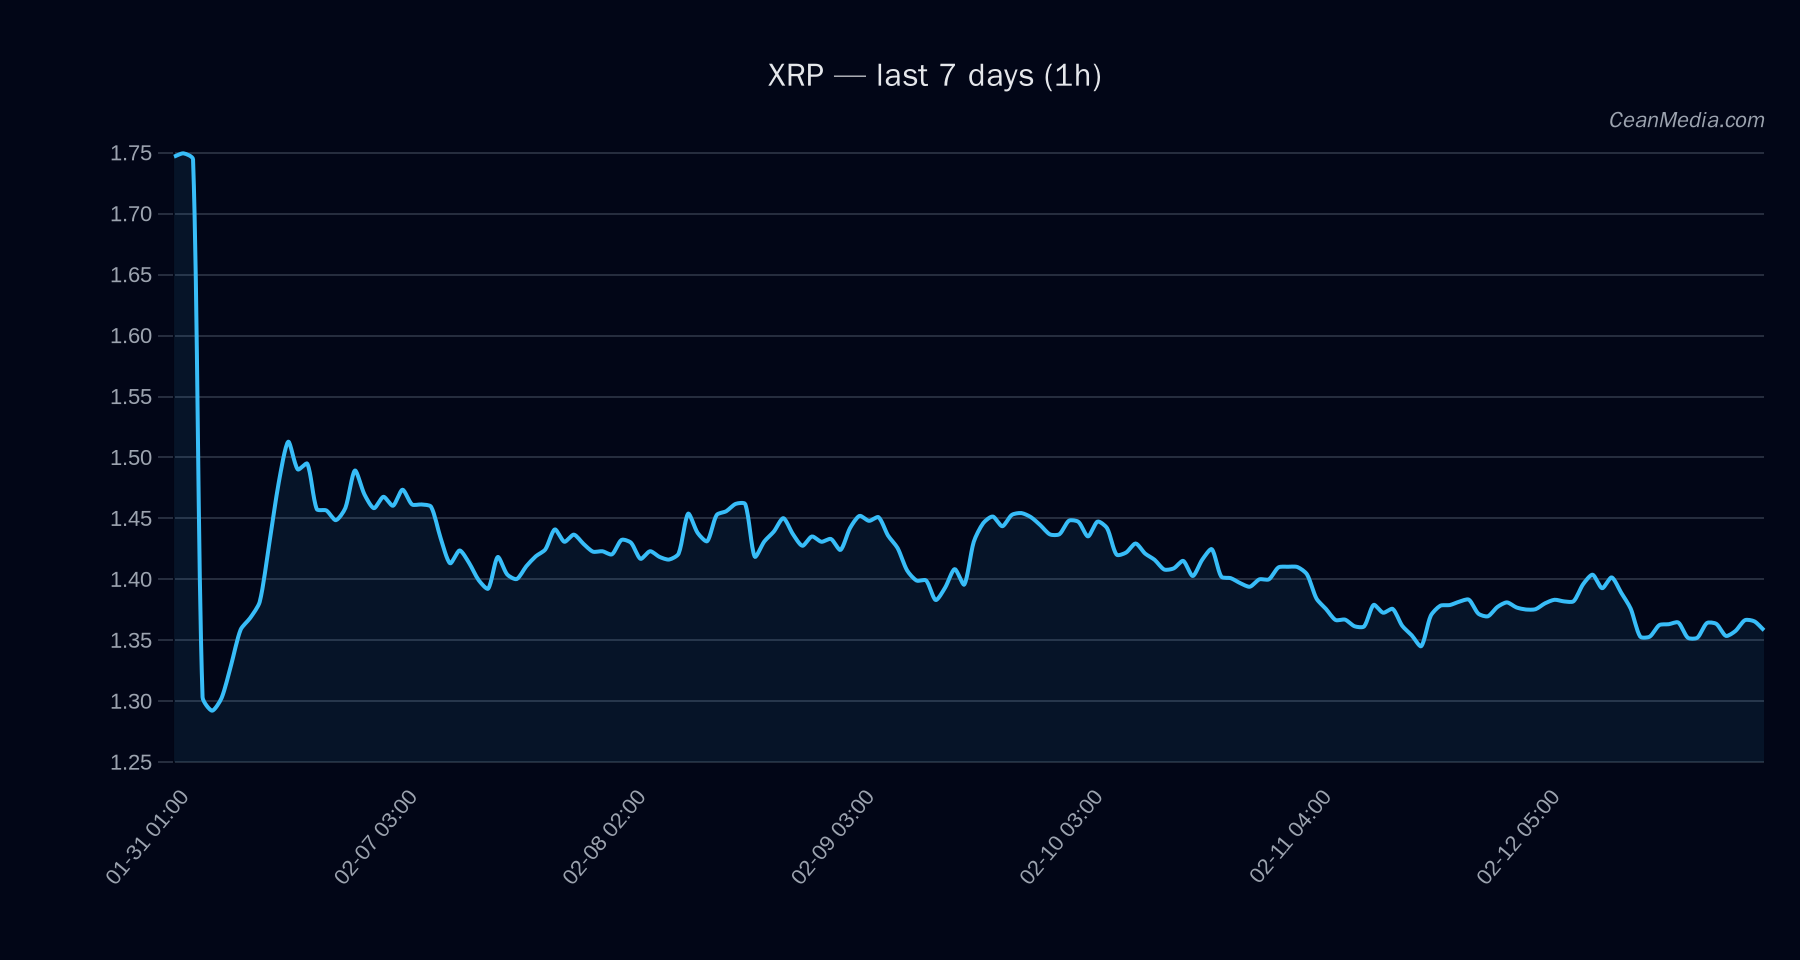
On 2026-02-13, XRP trades around 1.359 with near-term support at 1.34 and resistance at 1.38. The dataset shows a bearish short-term forecast (down 46%), with probabilities split as Up 38%, Sideways 16%, and Down 46%. Market breadth is fragile (Breadth>50h: 17%), and volatility is described as very low, suggesting limited intraday range despite the defined support and resistance levels.
Technical Analysis: XRP
- Key price levels: Support major 1.38; Near-term support 1.34. Resistance major 1.48; Near-term resistance 1.38. Upside breakout target if price closes > 1.38: 1.414 → 1.4417. Downside trigger if price closes < 1.34: 1.3053 → 1.2786.
- Trend and momentum: EMA12 < EMA26 and SMA50 < SMA200 indicate a bearish/negative slope. RSI at 44 supports neutral to modestly bearish momentum. 24h vol is very low, implying subdued trading activity.
- Forecast and bias: Forecast: down (46%). Bias bearish with a narrow decision window as price sits between key support and resistance.
- Invalidation/trigger levels: Invalidate bearish bias if 1h close exceeds 1.38 decisively, which would open toward 1.414–1.4417. Immediate bearish invalidation would require a sustained close above 1.38 with bullish momentum; however, the current reading favors watchful care around the 1.34–1.38 band.
Drivers
- Return 24h: -0.01
- EMA slope: -0.0007
- Funding Z-score: -0.23
- Basis Z-score: 0.04
- Order-book imbalance (EMA5): 0.15
- BTC Return 24h: -0.01
- BTC Volatility Regime: 1 (low)
- BTC Trend Strength: 0.29
The combination of a negative EMA slope, slight negative funding pressure, and subdued volatility supports a subdued risk environment for XRP in the near term, with the price likely to consolidate near the 1.34–1.38 range absent a catalyst.
ETF Flows (BTC/ETH)
ETF flow data provided is limited to BTC and ETH. BTC ETFs show a negative flow: 1D -$276.3M, 5D -$33.5M, 10D -$1.13B, while ETH ETFs show 1D -$129.1M, 5D -$111.4M, 10D -$449.1M. These figures represent BTC/ETH flow context and are not a primary signal for XRP. They reflect broader capital allocation shifts that can influence risk appetite and correlation dynamics in the crypto market, but XRP-specific signals should be interpreted independently of these ETF flows.
What to Watch Next
- Watch for a close above 1.38 as a potential bullish trigger toward 1.414–1.4417 levels.
- If price breaks below 1.34 decisively, monitor the path toward 1.3053–1.2786.
- Monitor RSI movements if volatility picks up; breaches above 50–60 could precede a re-rating of near-term momentum.
- Keep an eye on broader market sentiment and BTC/ETH ETF flows for context, recognizing they are supplementary to XRP-specific signals.
Hashtags: #XRP #TechnicalAnalysis #CryptoMarkets #BTC #ETH #ETFFlows #MarketSnapshot #Momentum #TradingStrategy #PriceLevels #SupportResistance