Market Snapshot
DOGE is trading between key near-term levels with a bearish tilt suggested by the short-term forecast. The asset sits within a defined band around 0.095–0.099, with a break above 0.099 potentially targeting 0.101–0.103, while a break below 0.095 could move toward 0.0932–0.0913. Overall momentum indicators reflect a cautious stance, with RSI at elevated levels and volatility in the very low regime.
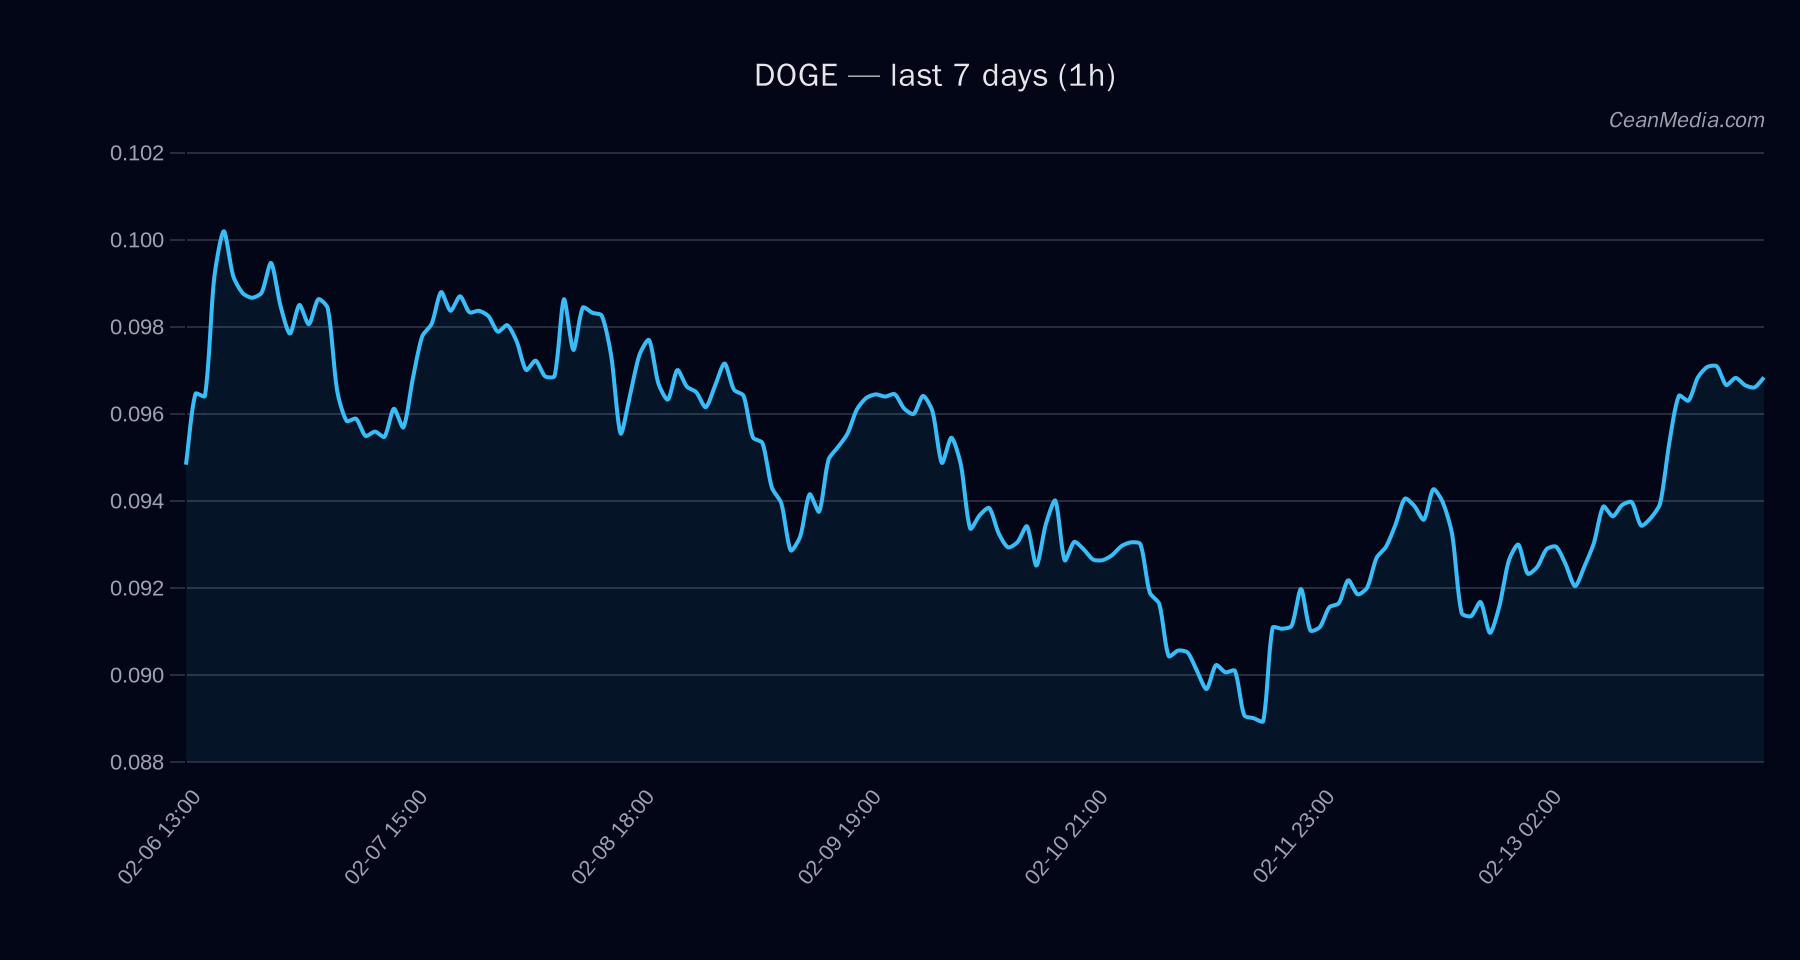
Technical Analysis: DOGE
Support major at 0.093, near support 0.095; Resistance near 0.099, major at 0.105. Break above 0.099 → 0.101–0.103; Break below 0.095 → 0.0932–0.0913. 0.0942
Drivers
- Top contributors include 24h return (0.04), EMA slope (0.0013), and funding/basis z-scores (≈1.0–1.46).
- Order-book imbalance (EMA5) at 0.02 indicates modest buying pressure but not a decisive signal.
- BTC-related context: 24h BTC return around 0.04 with BTC trend strength at 1.86, and BTC volatility regime indicating a non-extreme condition.
- Volatility regime for DOGE is very low, suggesting subdued price movement in the immediate horizon.
ETF Flows (BTC/ETH)
The ETF flow data provided reflects BTC and ETH instruments, not DOGE-specific signals. The data shows:
- BTC ETFs: +$24.5M in 1D, +$425.1M in 5D, -$602.4M in 10D.
- ETH ETFs: +$21.0M in 1D, -$12.5M in 5D, -$325.1M in 10D.
Interpretation: ETF flows are context for risk-on/off sentiment in broader markets. While BTC/ETH flows can influence overall market risk appetite, they are not primary signals for DOGE. The current flows suggest some USD reporting activity and mixed longer-dated positioning, contributing to a cautious risk backdrop rather than a direct DOGE price signal.
What to Watch Next
- Watch for a close above 0.099 to target 0.101–0.103.
- If price breaks below 0.095, monitor for weakness toward 0.0932–0.0913.
- Monitor remaining indicators for any shift in RSI from elevated levels versus a new downtrend signal.
- Keep an eye on BTC/ETH ETF flows as contextual risk sentiment, even though not a DOGE-specific signal.
Hashtags: #DOGE #CryptoAnalysis #TechnicalAnalysis #MarketSnapshot #ETFFlows #BTC #ETH #RiskOn #PriceAction #SupportResistance #TradingStrategy