Market Snapshot
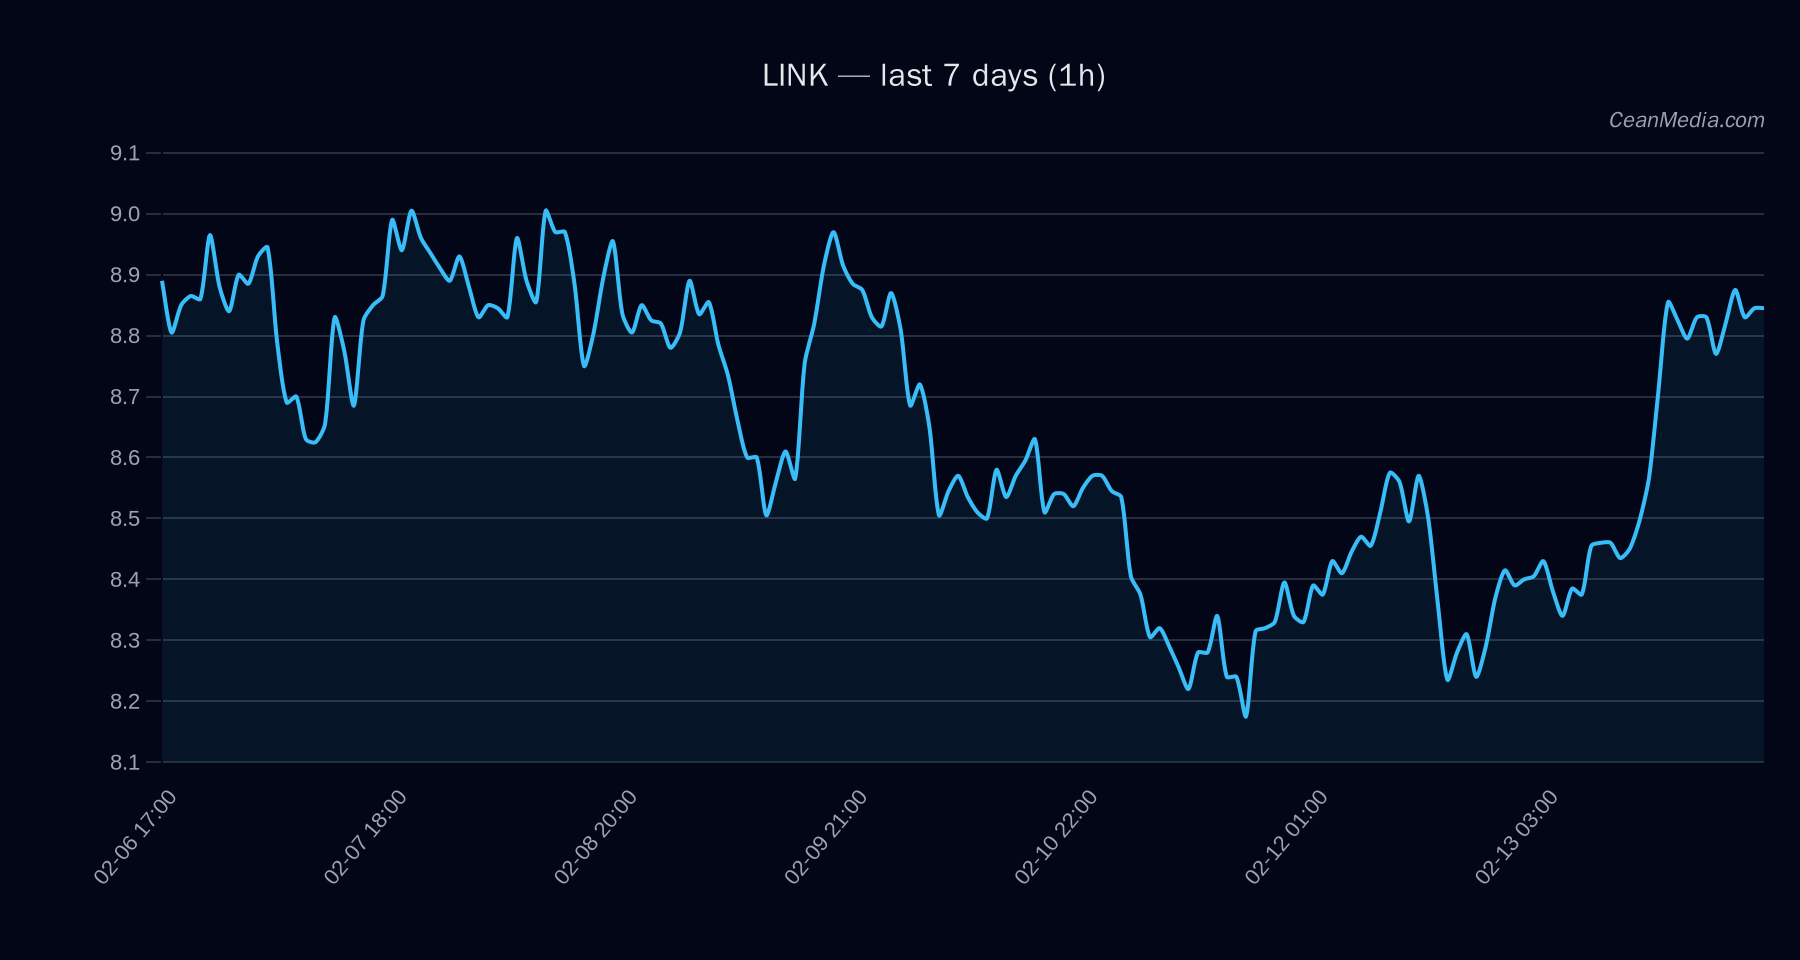
Price: 8.82. The near-term outlook for LINK sits between a major support at 8.4 (near 8.64) and a major resistance at 9.66 (near 9.0). The instrument is characterized by a mixed but slightly bearish tilt in the immediate horizon, with a 50% probability of downside and a 36% probability of upside according to the current forecast, and a notable tilt toward a down scenario if ether/alt dynamics remain muted.
Key band: P20–P80 is 8.5351–9.1362, providing a narrow trading range. The 1-hour upside break above 9 would open a path toward 9.1763–9.3563, while a breakdown below 8.64 targets 8.4707–8.2979. Market breadth remains positive (Breadth>50h at 100%), but volatility is described as very low, indicating a subdued intraday environment.
Technical Analysis: LINK
: - EMA12 > EMA26
- SMA50 < SMA200
- RSI 65 (neutral territory within an elevated zone)
- Volatility (σ24h) 0.63% — very low regime
- Support (Major): 8.4; Near: 8.64
- Resistance (Major): 9.66; Near: 9.0
Drivers
- Return 24H: 0.06%
- EMA Slope: 0.0016
- Funding Z-Score: 0.13
- Basis Z-Score: 0.59
- Order-Book Imbalance (EMA5): 0.08
- BTC Return 24H: 0.04%
- BTC Vol Regime: Very low
- BTC Trend Strength: 1.85
Contextual breadth data indicates broad participation with 100% breadth in the last 50 hours, while macro risk sentiment remains muted by low volatility. The overall sentiment metrics align with a cautious stance rather than a strong directional bet for LINK in the near term.
ETF Flows (BTC/ETH)
The ETF flow data provided is limited to BTC and ETH and is presented as context rather than a primary signal for LINK. Interpretation: net flows suggest cautious positioning in BTC and ETH, which can influence crypto risk-on risk-off dynamics but should not be taken as a direct directional indicator for LINK itself.
- BTC ETF: +$24.5M (1D); +$425.1M (5D); -$602.4M (10D)
- ETH ETF: +$21.0M (1D); -$12.5M (5D); -$325.1M (10D)
In aggregate, BTC/ETH ETF flows imply a mixed but modestly supportive backdrop for BTC on shorter horizons, with ETH showing pockets of retracement in medium frames. This context can influence overall market sentiment but is not a substitute for asset-specific technicals and fundamentals for LINK.
What to Watch Next
- Monitor for a close above 9.00 to target 9.1763–9.3563 on a clean breakout.
- Watch for a breakdown below 8.64 to confirm a move toward 8.4707–8.2979.
- Keep an eye on RSI for signs of overextension or renewed momentum in the 60s–70s range.
- Assess BTC/ETH risk-on signals in conjunction with LINK’s own price patterns for any confirmation bias on a directional move.
Hashtags: #LinkedInAnalytics #LINKMarket #CryptoAnalysis #TechnicalAnalysis #ETFFlows #BTC #ETH #Altcoins #CryptoMarkets #MarketSnapshot #TradingStrategy #CryptoNews