Market Snapshot
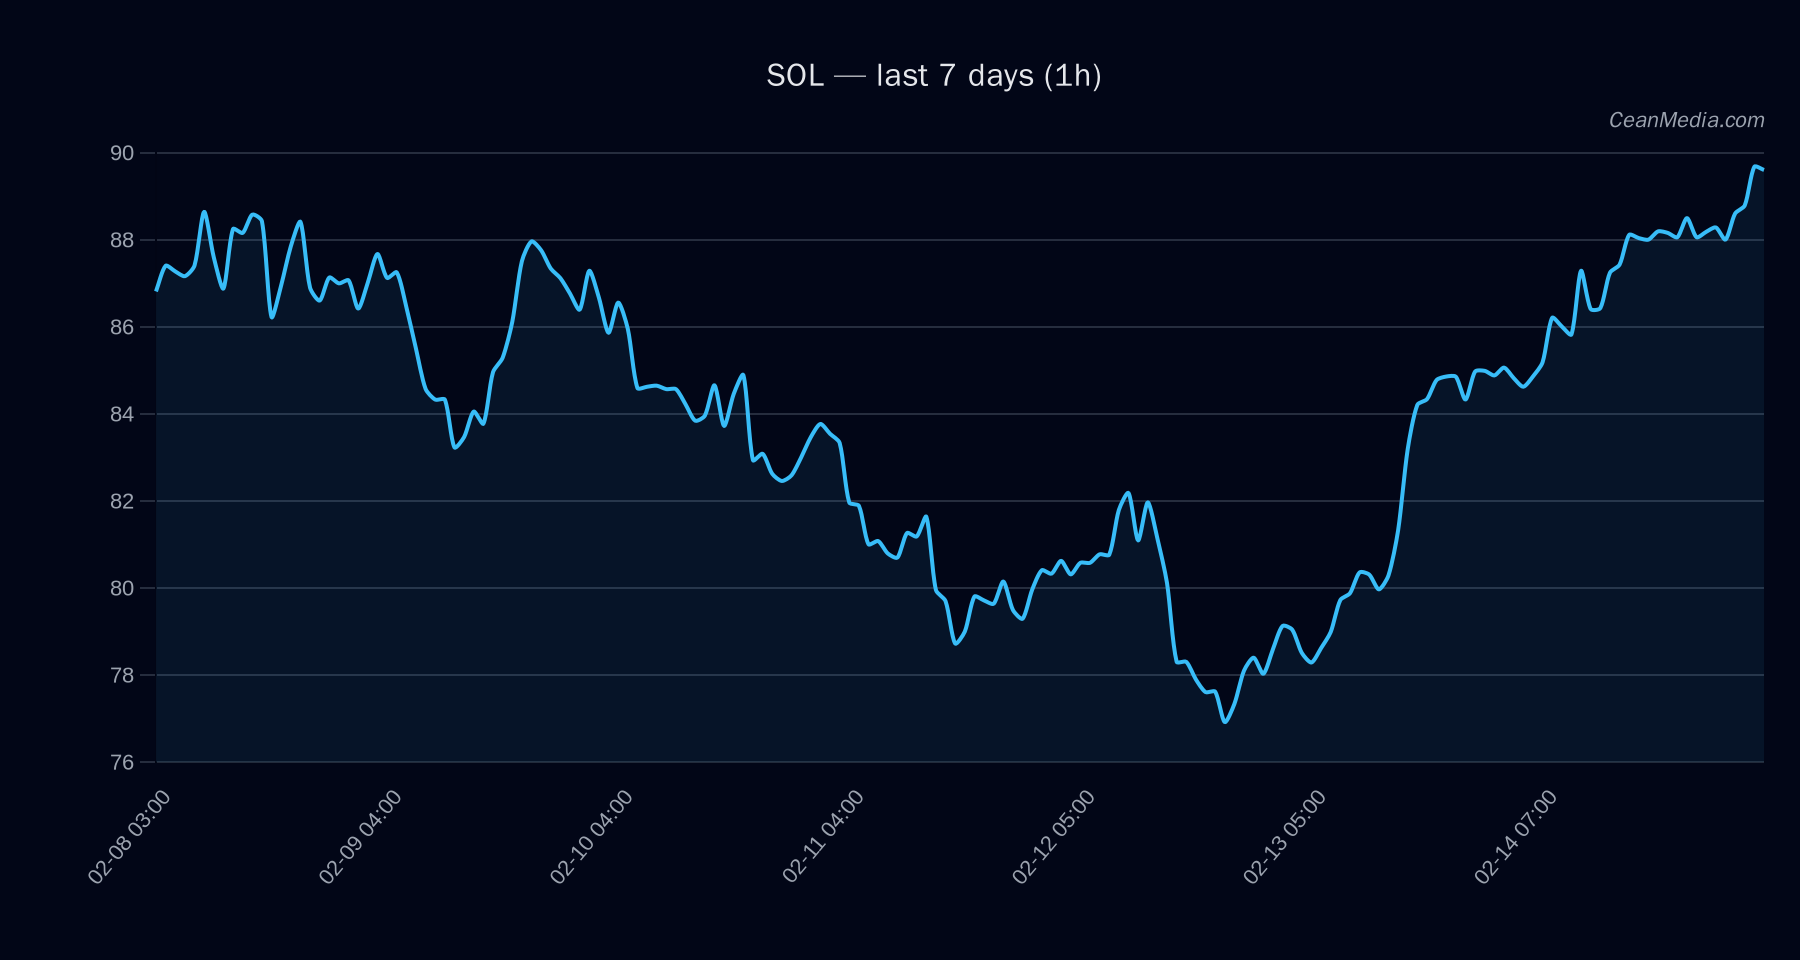
As of 2026-02-15, SOL trades around the 90 price level with a short-term forecast tilted to the downside. The immediate range is defined by a P20–P80 band of approximately 87.09 to 94.70, with near-term support at 88.8 and resistance at 92.4. The price sits between the major support and resistance, suggesting a potential breakout or breakdown depending on intraday momentum and macro cues. Contextual market breadth remains favorable but volatility is reported as very low.
Technical Analysis: SOL
- Price: 90.59
- Bias: Short-term bearish (Down 48%), with upside probability around 42% and minor sideways risk (9%).
- Key indicators:
- EMA12 > EMA26
- SMA50 > SMA200
- RSI ~80 (overbought)
- Volatility regime: Very low (σ24h ≈ 0.60%)
- Support / Resistance:
- Major Support: 85.9
- Near Support: 88.8
- Major Resistance: 95.3
- Near Resistance: 92.4
- Triggers:
- Upside scenario: 1h close > 92.4 → potential move toward 94.25–96.10
- Downside scenario: 1h close < 88.8 → potential move toward 87.00–85.23
- Invalidation: A sustained break above 95.3 or below 85.9 would invalidate the near-term basing assumptions and imply a new short-term regime.
Drivers
- Return 24H: +0.06
- EMA Slope: +0.0022
- Funding Z-Score: -1.06
- Basis Z-Score: +1.02
- Order-book Imbalance (EMA5): +0.01
- BTC Return 24H: +0.02
- BTC Vol Regime: 0
- BTC Trend Strength: 0.975
ETF Flows (BTC/ETH)
The ETF flows data provided is limited to BTC and ETH and should be interpreted as context rather than a primary signal for SOL. In the observed window, BTC ETFs show +$15.1M (1D) and +$415.7M (5D) with +$0.0 for 10D; ETH ETFs show +$11.7M (1D) and -$21.8M (5D) with -$334.4M (10D). This implies a general near-term risk-on tilt in BTC and mixed to negative momentum for ETH over longer horizons, but these signals do not directly determine SOL price action. Traders should consider ETF flows as macro context rather than a SOL-specific trigger.
What to Watch Next
- Monitor a close above 92.4 to confirm near-term upside potential toward 94.25–96.10.
- Watch for a break below 88.8 to validate a downside sweep toward 87.00–85.23.
- Assess RSI dynamics if price nears 90–92 range, as overbought conditions may precede a pullback.
- Keep an eye on BTC/ETH ETF flow shifts as supplementary market context, not primary SOL drivers.
Hashtags: #Solana #SOL #CryptoMarkets #TechnicalAnalysis #ETFFlows #BTC #ETH #MarketSnapshot #TradingStrategy #CryptoNews