Market Snapshot
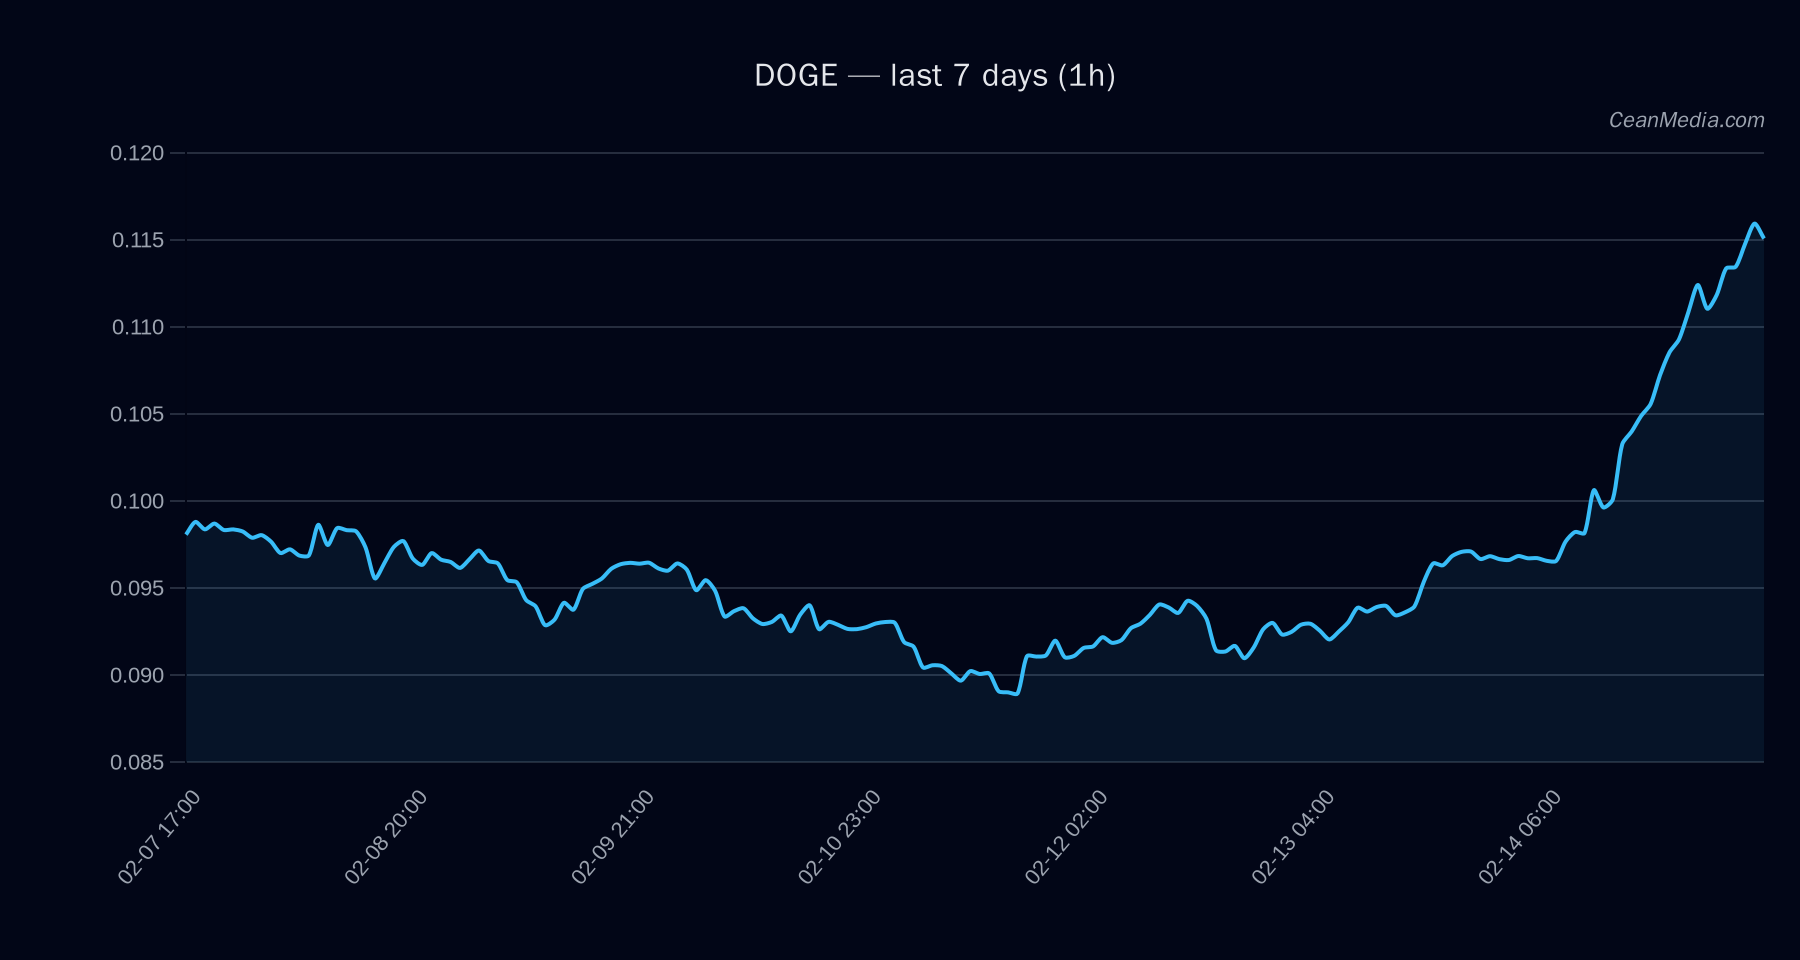
Price: 0.1136. The market for DOGE remains range-bound between key levels near 0.11 and 0.115, with a near-term lean toward downside given the current technical setup and a high overbought RSI reading. The broader backdrop includes low volatility regime and mixed sentiment signals, with ETF flows for BTC and ETH providing context for risk appetite rather than direct DOGE signals.
Technical Analysis: DOGE
DOGE sits between support at 0.11 (near) and resistance at 0.115 (near); a break above 0.115 targets 0.1182–0.1205, while a break below 0.11 targets 0.1091–0.1069. Support major 0.095; Resistance major 0.125; P20–P80 band 0.1137–0.1256. P50 around 0.1159. A sustained close above 0.125 would alter the immediate bias toward bullish continuation; a break below 0.095 would shift the downside target and invalidate the stated near-term range.
Drivers
- Top factors: 24h return (0.19), EMA slope (0.0053), funding z-score (1.05), basis z-score (0.33), order-book imbalance (EMA5) (0.04).
- Momentum indicators: RSI at 75 indicates overbought pressure within a bullish context; volatility regime described as Low with σ24h around 1.09%.
- BTC contextual signals: BTC 24h return (0.02) and BTC trend strength (0.97) suggest a constructive but modest risk-on backdrop, though BTC volatility regime remains low.
- Overall breadth indicators show breadth>50h at 100% and a calm vol regime, which can sustain a narrow trading range for DOGE.
ETF Flows (BTC/ETH)
The reported ETF flows cover BTC and ETH only and are provided to contextualize the broader risk environment. BTC ETF: +$15.1M (1D), +$415.7M (5D), -$611.8M (10D). ETH ETF: +$11.7M (1D), -$21.8M (5D), -$334.4M (10D).
Interpretation: These BTC/ETH flows reflect risk-on/off sentiment in asset markets and can influence correlated assets. They are not a direct signal for DOGE and should be treated as context for the overall market environment rather than a primary driver for DOGE price action.
What to Watch Next
- Watch for a close above 0.115 to gauge potential near-term upside to 0.1182–0.1205.
- Monitor a break below 0.11 for possible acceleration toward 0.1091–0.1069.
- Observe changes in RSI with a move away from overbought levels, which could precede adjustive price action.
- Consider shifts in BTC/ETH ETF flows as a contextual barometer for risk appetite and potential cross-asset correlations.
Hashtags: #Dogecoin #CryptoMarket #TechnicalAnalysis #BTCFlows #ETHFlows #MarketSnapshot #PriceAction #RSI #EMA #SMA