Market Snapshot
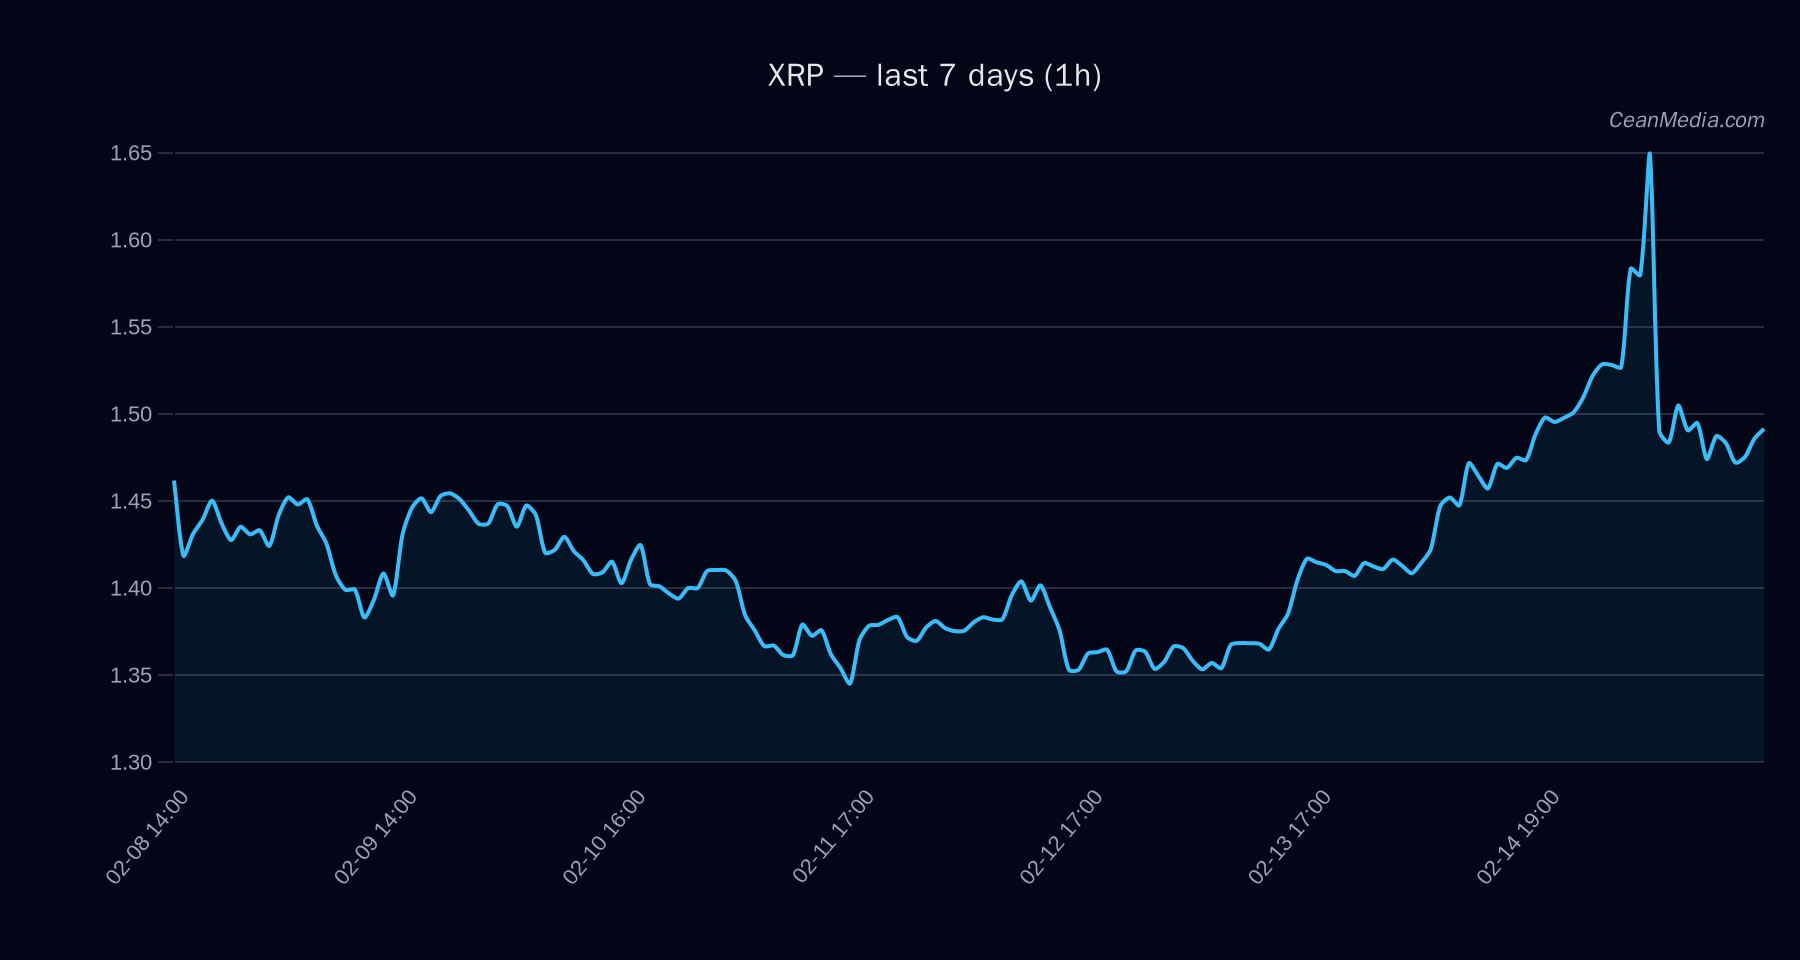
Price ( XRP ): 1.4851 on 2026-02-16 with a near-term bias toward a downside scenario. The market is characterized by a bearish short-term forecast (52% probability of downside) while intraday momentum remains mixed with RSI near neutral (49). Key support is at 1.46, with major support nearby at 1.38. Resistance is seen around 1.52 (near) and 1.86 (major). Break above 1.52 opens a path toward 1.5451–1.5819; break below 1.46 risks a move toward 1.4263–1.3895.
Technical Analysis: XRP
Trading between 1.46 support and 1.52 near-term resistance. Band (P20–P80) 1.4649–1.4963. Forecast: down (52%). EMA12 > EMA26 and SMA50 > SMA200 indicating underlying bullish crossover signals, RSI 49 (neutral). Volatility regime: Low (σ24h ≈ 2.38%). Support: 1.46 (near) and 1.38 (major). Resistance: 1.52 (near) and 1.86 (major). Upside trigger: close > 1.52 targets 1.5451–1.5819. Downside trigger: close < 1.46 targets 1.4263–1.3895.
Drivers
EMA slope (-0.0002) and funding Z-score (-1.26) indicate mild negative price pressure; basis Z-score around 0.20 suggests modest positive basis signal in the data set. Order-book imbalance (EMA5) at -0.07 indicates slightly skewed selling pressure within the short window. Vol regime is Low; breadth readings show mixed participation (approx. 50% breadth in the last observed window). 7-day trend indicators and BTC-related metrics show limited direct correlation given lack of BTC return data in the current read.
ETF Flows (BTC/ETH)
Contextual note: ETF flow data provided pertains to BTC and ETH and is not a primary signal for XRP. It offers macro risk sentiment context that can influence risk-on/risk-off impulses across crypto markets. Current snapshot shows:
- BTC ETF: 1D +$15.1M, 5D +$415.7M, 10D -$611.8M
- ETH ETF: 1D +$11.7M, 5D -$21.8M, 10D -$334.4M
What to Watch Next
- Monitor if XRP closes above 1.52 for a validation of the upside target toward 1.5451–1.5819.
- Observe a daily close below 1.46 to confirm a potential test of 1.4263–1.3895.
- Assess any shifts in EMA crossovers or RSI momentum that could alter immediate bias.
- Keep an eye on broader market risk signals from BTC/ETH ETF flows as a contextual gauge for risk appetite.
Hashtags: #XRP #CryptoMarket #TechnicalAnalysis #ETFFlows #BTC #ETH #MarketSnapshot #Momentum #SupportResistance