Market Snapshot
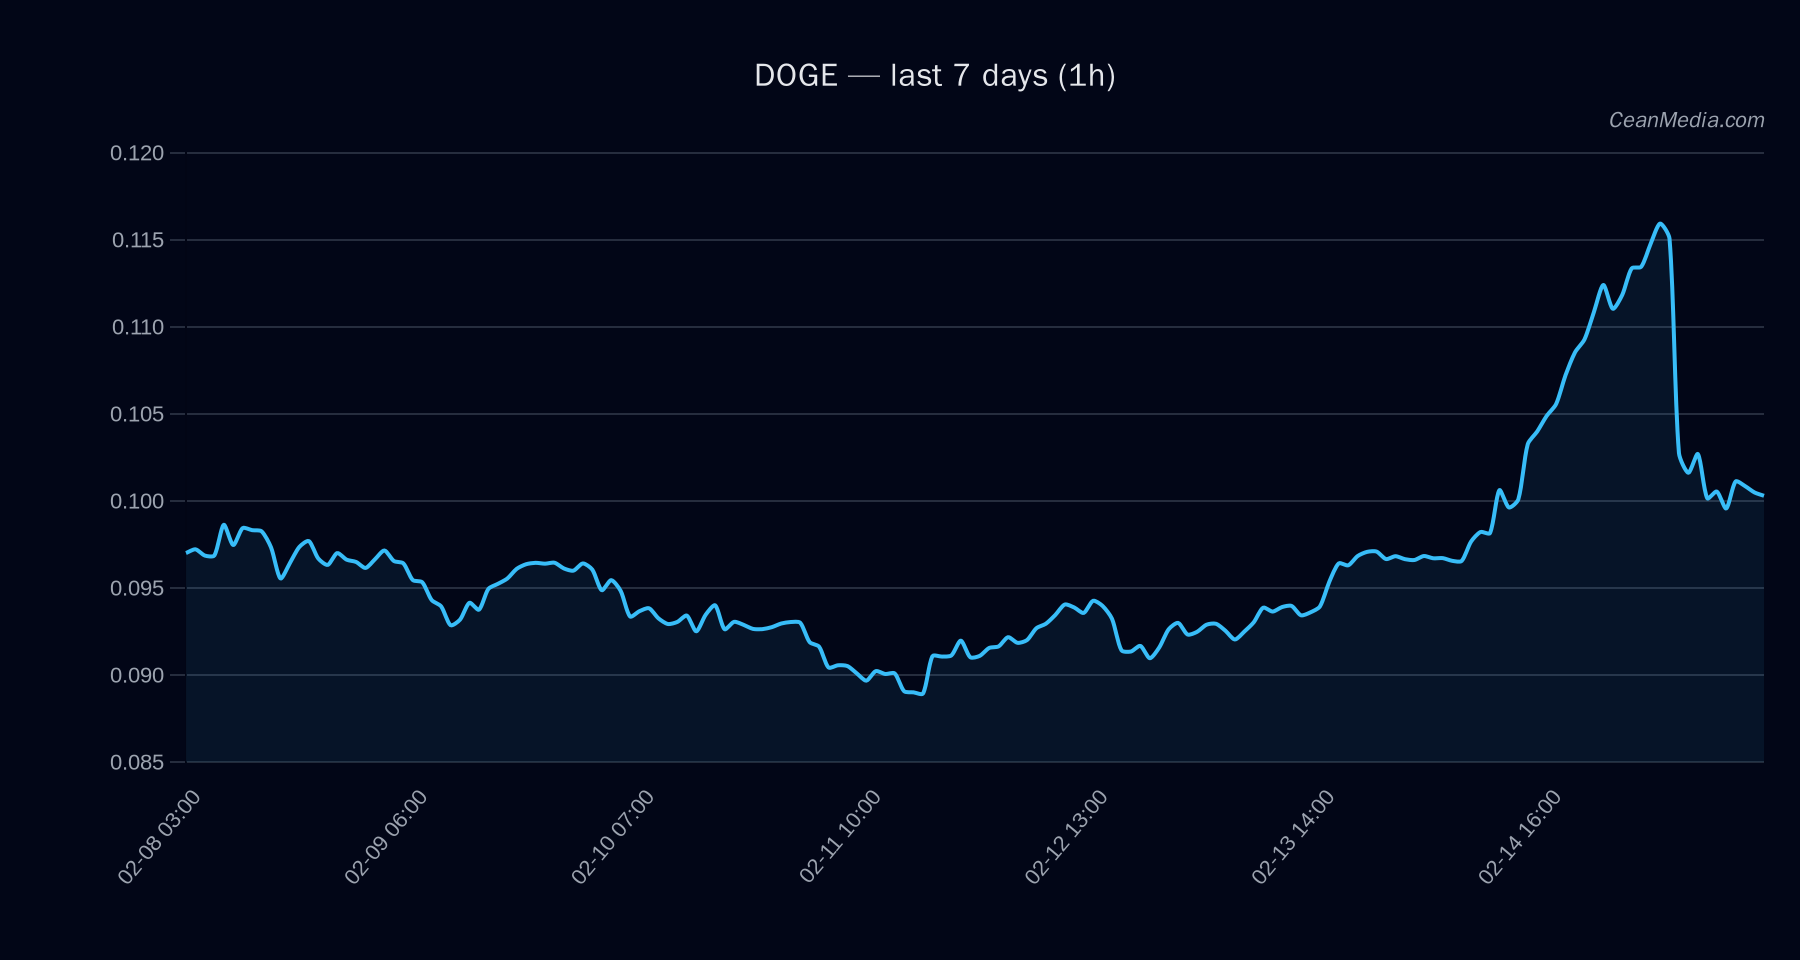
Primary asset: DOGE. Current price around 0.100–0.101, with near-term support at 0.099 and resistance at 0.105. The 24-hour volatility regime is reported as Low, with RSI around 41 indicating neutral momentum. Broad context signals include EMA slope negative, SMA50 above SMA200, and a mixed distribution of probabilities, with a Down forecast at 53% and Up at 35% for the immediate horizon.
Technical Analysis: DOGE
- Support (Major): 0.093
- Support (Near): 0.099
- Resistance (Near): 0.105
- Resistance (Major): 0.125
Break above 0.105 implies a move toward 0.1049–0.1075 in the near term. Break below 0.099 implies a drop toward 0.0968–0.0942. RSI around 41, EMA12 (below EMA26), volatility regime: Low. These factors support a cautious, range-bound posture with potential for a downside tilt if 0.099 fails. EMA slope negative (-0.0045) and funding/basis z-scores modestly negative, suggesting mildly negative funding balance and valuation pressure in the short term. Order-book imbalance (EMA5) is positive but small (0.04), indicating limited immediate bullish pressure.
Drivers
- Top factor: EMA slope negative, signaling a gentle downward drift in price trend.
- Funding Z-score: -1.4 and Basis Z-score: -0.94, indicating modest bearish signals from funding imbalance and valuation metrics.
- Order-book imbalance (EMA5): +0.04, suggesting limited buy-side pressure but not a strong reversal signal.
- Volatility regime: Low, which can accompany range-bound trading and slower breakout behavior.
- Bitcoin derivatives context (BTC ETF flows): Positive ETF flows for BTC in 1D and 5D windows, contributing to broader risk-on market backdrop, though Bitcoin data figures are not asset-specific for DOGE.
ETF Flows (BTC/ETH)
Context: ETF flow data provided is limited to BTC and ETH. These flows reflect broader risk sentiment and liquidity conditions in the crypto markets but should not be treated as a primary signal for DOGE. Current observations show BTC ETFs with positive 1D and 5D inflows and a 10D net outcome of a mix between inflows and outflows, implying a cautious but constructive risk-on tilt in the broader market. ETH ETF flows show a similar nuanced pattern. Use these signals as macro context rather than direct DOGE catalysts.
- BTC ETF: 1D +$15.1M; 5D +$415.7M; 10D -$611.8M
- ETH ETF: 1D +$11.7M; 5D -$21.8M; 10D -$334.4M
What to Watch Next
- Watch for a clear move above 0.105 to confirm near-term bullish bias and target the 0.1075 area.
- Monitor for a breach of 0.099 support; failure could open a path toward 0.0968–0.0942.
- Observe any shifts in EMA12 vs EMA26 and RSI movement away from the 40–60 range for early momentum signals.
- Keep an eye on BTC/ETH ETF flow shifts as macro risk-on/off context, while continuing to treat DOGE signals as asset-specific rather than ETF-driven.
Hashtags: #DOGE #CryptoAnalysis #TechnicalAnalysis #CryptoMarkets #ETFFlows #BTC #ETH #MarketSnapshot #TradingView #PriceAction #RiskOn #Liquidity