Market Snapshot
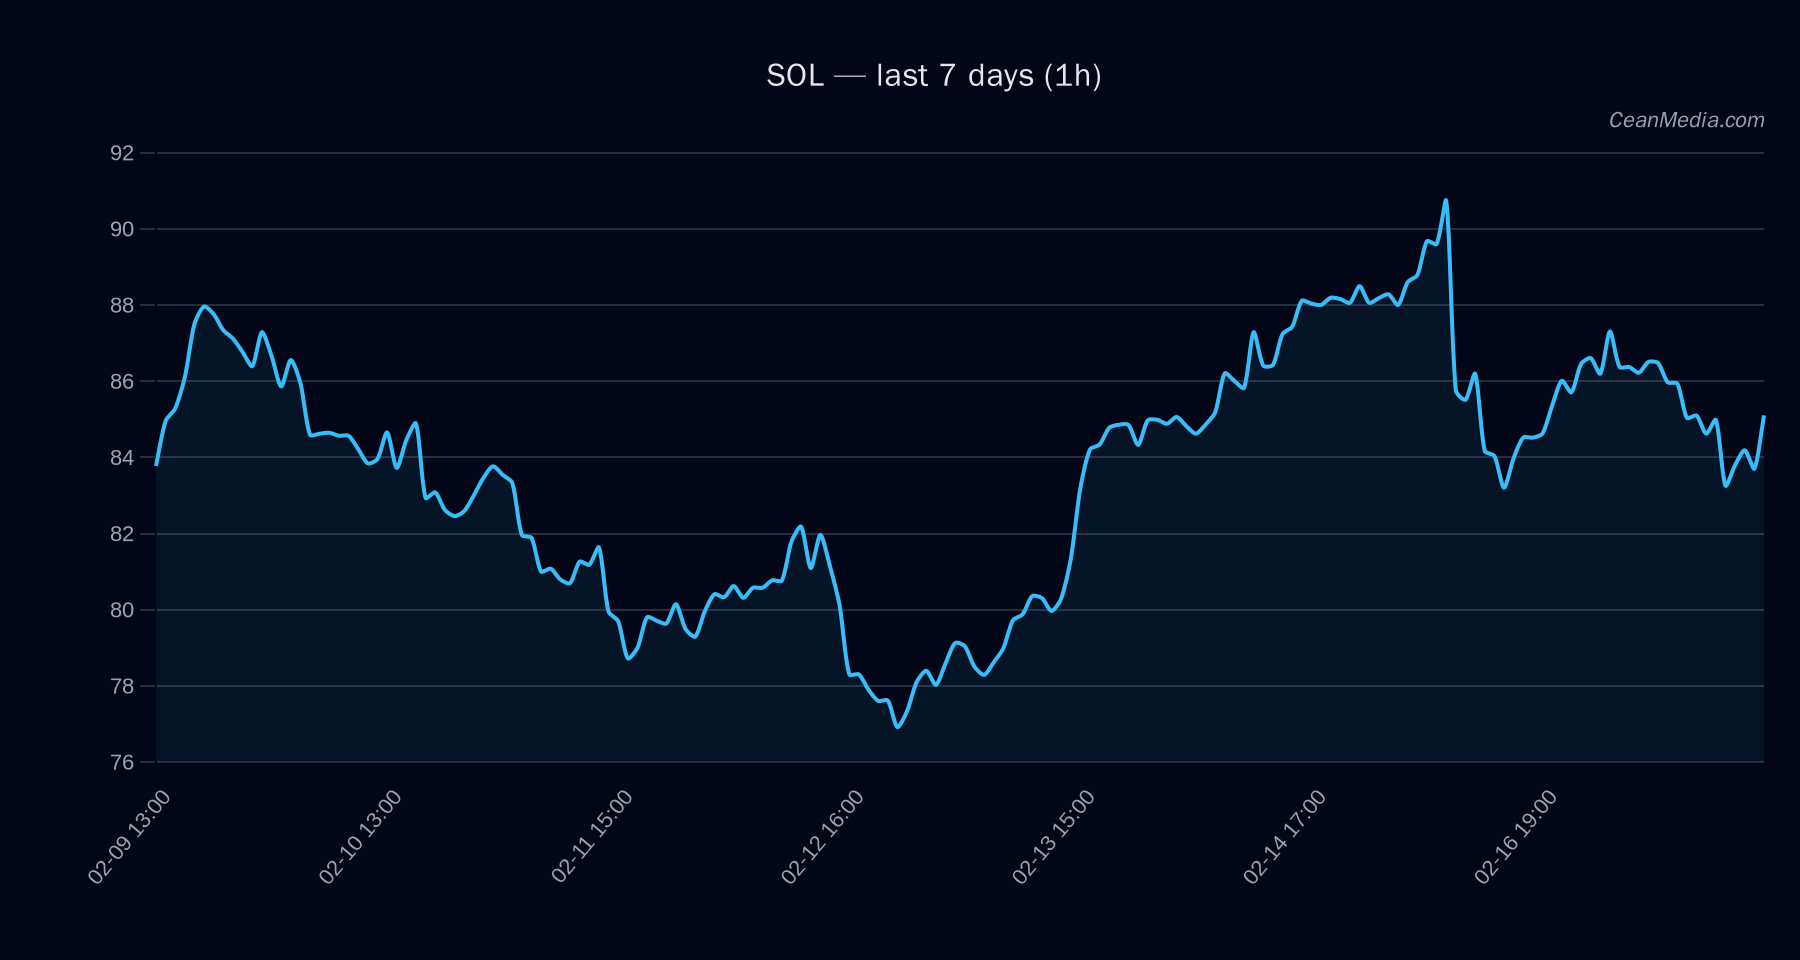
SOL trades near the 83.1 support and 86.5 resistance band after a session characterized by very low volatility. The near-term bias sits in the down/sideways zone, with the forecast at 48% probability of a move lower and 42% probability of an upside move, indicating a balanced but cautious short-term stance.
- Price: 84.8
- Band (P20–P80): 84.48 – 89.49
- Support → Major: 80; Near: 83.1
- Resistance → Major: 92.3; Near: 86.5
Technical Analysis: SOL
Current configuration shows EMA12 < EMA26 and SMA50 > SMA200, with RSI at 47 and volatility (σ24h) at 0.77%, indicating a neutral to mildly cautious posture. The market is range-bound between key levels, pending a breakout trigger.
Support 83.1; Resistance 86.5 (near) - Break above 86.5 → potential move toward 88.23 – 89.96
- Break below 83.1 → potential move toward 81.44 – 79.78
RSI 47 (neutral). Vol regime: Very low Down (48%), with sideways TA context.
Drivers
- Top 5 contributors to the current setup include: 24h return (~0.69%), EMA slope (~0.08%), and marginal negative funding z-score (~-0.70) with BASIS z-score (~-0.33).
- Order-book imbalance (EMA5) at -0.09, BTC 24h return (~0.34%), and BTC trend strength (~0.12) reflect mixed intraday dynamics and subdued alt activity.
- Overall volatility regime is very low, aligning with the restrictive range observed in price action.
ETF Flows (BTC/ETH)
The ETF flow context provided here pertains only to BTC and ETH, not SOL. Cash inflows in BTC (+$15.1M for 1D, +$415.7M for 5D, +$? for 10D) and ETH (+$11.7M for 1D, -$21.8M for 5D, -$334.4M for 10D) offer a broad market backdrop that can influence risk appetite and capital allocation in crypto markets. This data should be interpreted as contextual and not a primary signal for SOL pricing.
- BTC ETF: 1D +$15.1M | 5D +$415.7M | 10D -$611.8M
- ETH ETF: 1D +$11.7M | 5D -$21.8M | 10D -$334.4M
What to Watch Next
- Monitor price action if SOL breaks above 86.5 to validate a potential move toward 88.23 – 89.96.
- Watch for a break below 83.1 to assess downside risk toward 81.44 – 79.78.
- Keep an eye on BTC/ETH ETF flow context as a macro backdrop signal, noting that ETF data is contextual rather than a SOL-specific trading signal.
- Observe volatility regime shifts and RSI movement for clues of momentum re-expansion or compression.
Hashtags: #SOL #Solana #CryptoAnalysis #MarketForecast #ETFFlows #BTC #ETH #CryptoNews #PriceAction #TechnicalAnalysis #TradingStrategy