Market Snapshot
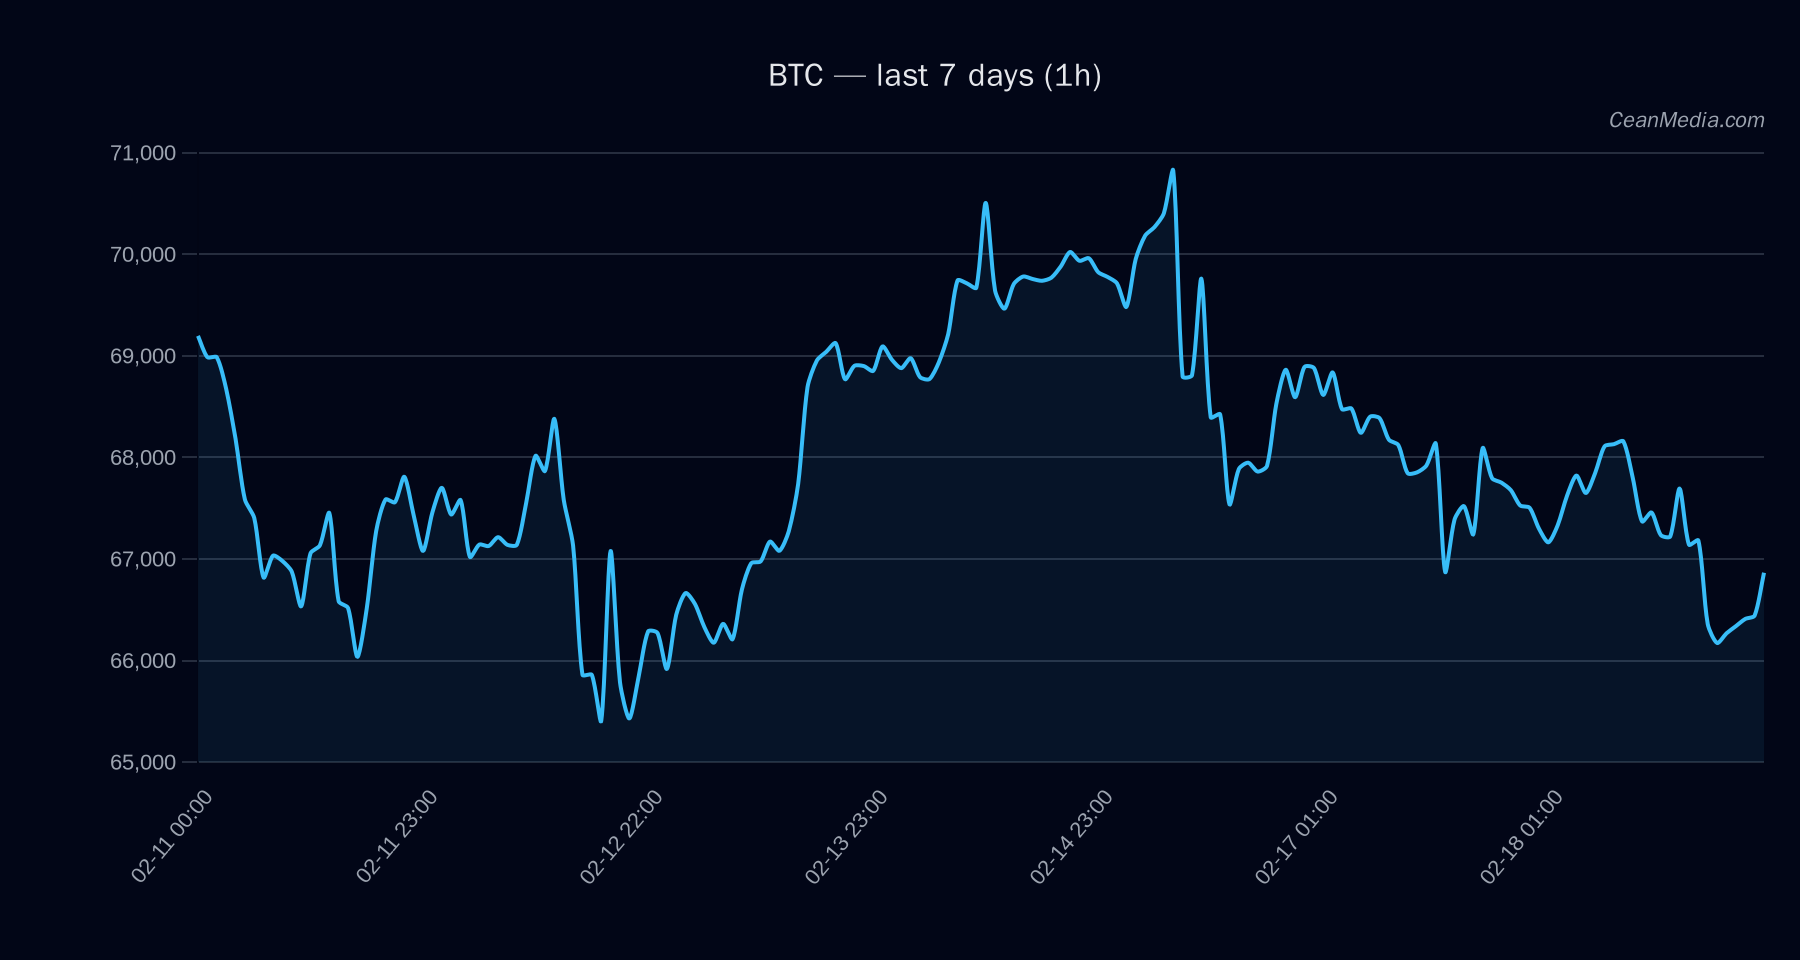
BTC trades near the 66,700 region with a defined near-term range between 65,400 support and 68,075 resistance. The broader signal remains cautious, with market breadth subdued and volatility described as very low. The latest data show a modest 24H return of -0.45% and a neutral to bearish bias under the current setup.
Technical Analysis: BTC
Key levels:
- Major Support: 66,975 (near 65,400)
- Major Resistance: 70,375 (near 68,075)
- Intraday/1H considerations: Break above 68,075 targets 69,429.84 to 70,791.20. Break below 65,400 targets 64,091.13 to 62,783.15.
Bias and momentum: Favoring a bearish tilt in the short term (confidence around 49% for a down move). The EMA relationship indicates EMA12 < EMA26 and SMA50 < SMA200, corroborating a defensive posture. RSI at 43 reinforces a neutral-to-bearish stance. Volatility regime described as Very Low, suggesting limited short-term swings.
Traders’ triggers:
- Upside trigger: 1H close above 68,075 → potential move toward 69,429.84–70,791.20.
- Downside trigger: 1H close below 65,400 → potential move toward 64,091.13–62,783.15.
Invalidation: A sustained close above 70,375 would shift the near-term bias away from the current bearish signal, potentially opening a path for higher levels.
Drivers
- Return 24H: -0.45%
- EMA Slope: +0.00024
- Funding Z-Score: -0.66
- Basis Z-Score: +0.28
- Order Book Imbalance (EMA5): +0.25
- BTC Trend Strength: +0.20
- Volatility regime: Very Low
- Distance from MA: -1.33%
Overall, momentum indicators show a cautious stance with limited directional conviction. Market breadth remains below long-run averages, suggesting that any breakout may need additional catalyst to sustain.
ETF Flows (BTC/ETH)
ETF flows provide context on market sentiment but are not a primary signal for BTC price action. The data presented cover BTC and ETH ETFs with the following recent shifts:
- BTC ETF: Day +$14.8M, 5D +$59.4M, 10D -$87.3M
- ETH ETF: Day +$27.9M, 5D +$34.7M, 10D -$42.3M
Interpretation: The 1D to 5D ETF flows show a modest positive tilt for BTC and ETH in the short horizon, aligning with a light risk-on environment. However, the BTC-specific price action still reflects intra-range dynamics and the technical setup described above. Investors should treat ETF data as contextual rather than a primary driver for BTC moves.
What to Watch Next
- Monitor 68,075 as the immediate upside trigger for a potential move toward 69,429–70,791.
- Watch for a close below 65,400 to validate the downside target range toward 64,091–62,783.
- Keep an eye on macro catalysts and USD/stock correlations that could alter intra-range dynamics.
- Reassess once volatility regime shifts from Very Low to a higher regime, which could accompany larger price swings.
Hashtags: #BTC #Bitcoin #MarketAnalysis #TechnicalAnalysis #ETFFlows #CryptoMarkets #TradingStrategy #PriceAction #RiskManagement #CryptoNews