Market Snapshot
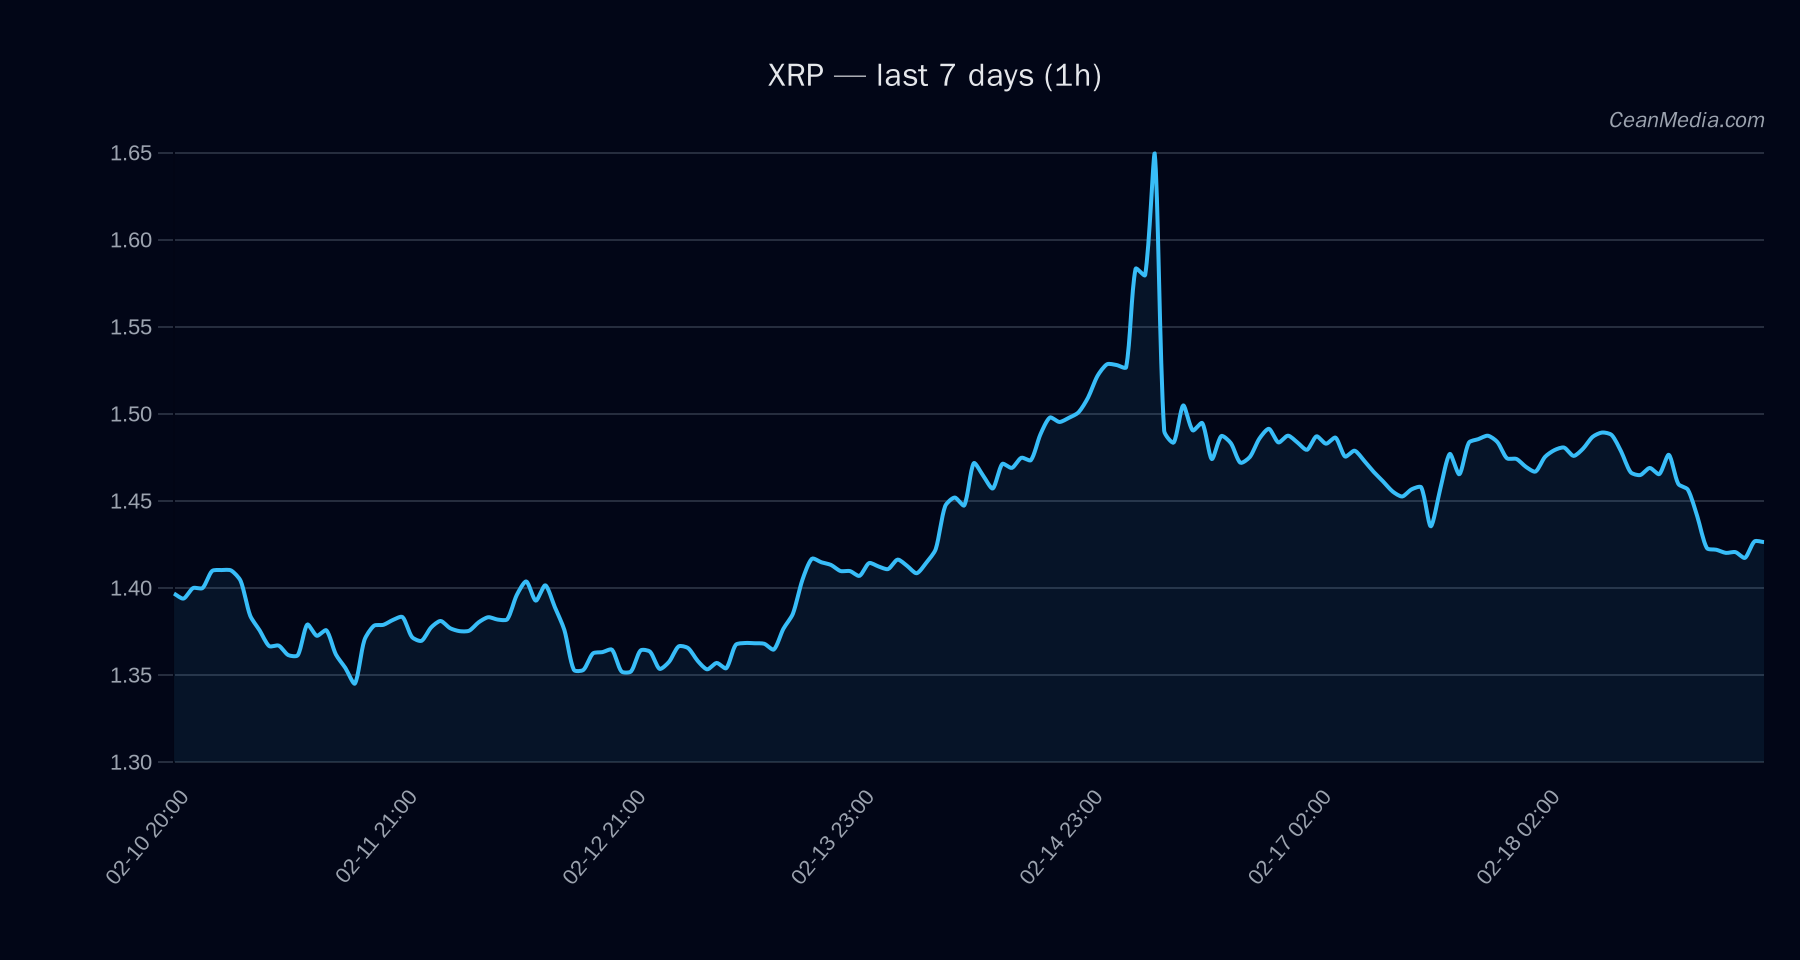
Primary asset: XRP. Latest price around 1.43–1.45. Short-term bias projects a bearish tilt with a 49% probability of downside, 47% probability of upside, and an overall sideways trend indicator per current TA. Market breadth remains weak with very low volume regime and a Fear/Greed index showing Extreme Fear in recent readings.
Technical Analysis: XRP
- Support (Major): 1.38
- Support (Near): ~1.40
- Resistance (Near): ~1.46
- Resistance (Major): 1.56
- Band (P20–P80): 1.4151 – 1.5049
- Current setup: EMA12 is below EMA26; SMA50 above SMA200; RSI at 35; 24h volatility very low. The RSI is in the neutral territory but on the lower side, implying limited upside momentum in the near term.
- Bias and triggers: Forecast: sideways to down. Upside trigger: a daily close above 1.46 could target 1.4832–1.5123. Invalidation (bearish): daily close below 1.40 could open a path toward 1.3691–1.3412.
- Probabilistic outlook: Up ~47%, Sideways ~4%, Down ~49% for the immediate horizon.
- Momentum indicators: Trend slope modestly negative, volatility regime very low, and recent price action is confined within the 1.38–1.46 zone.
Drivers
- Top factors (selected):
- Return 24h: -0.03
- EMA slope: -0.0012
- Funding z-score: 0.51
- Basis z-score: -0.49
- Order-book imbalance (EMA5): 0.01
- BTC return (24h): -0.0074
- Interpretation: The balance of momentum and funding signals currently leans slightly negative with limited volatility. BTC-related drivers are negative over the past 24 hours, but overall BTC trend strength remains modest.
ETF Flows (BTC/ETH)
Context: ETF flow data provided here covers BTC and ETH only and should be interpreted as supplementary context rather than a primary signal for XRP. Latest data shows:
- BTC ETF: 1D +$14.8M | 5D +$59.4M | 10D -$87.3M
- ETH ETF: 1D +$27.9M | 5D +$34.7M | 10D -$42.3M
What to Watch Next
- Monitor a daily close above 1.46 for potential bullish extension toward 1.4832–1.5123.
- Watch for a break below 1.40 for downside acceleration toward 1.3691–1.3412.
- Observe changes in volatility regime; a shift from very low to higher volatility could precede larger moves.
- Keep BTC/ETH ETF flows in view as supplementary risk-on/off context, not as XRP signals.
Hashtags: #XRP #CryptoAnalysis #TechnicalAnalysis #MarketSnapshot #ETFFlows #BTC #ETH #PriceAction #TradingPlan #CryptoMarkets #XRPForecast