Market Snapshot
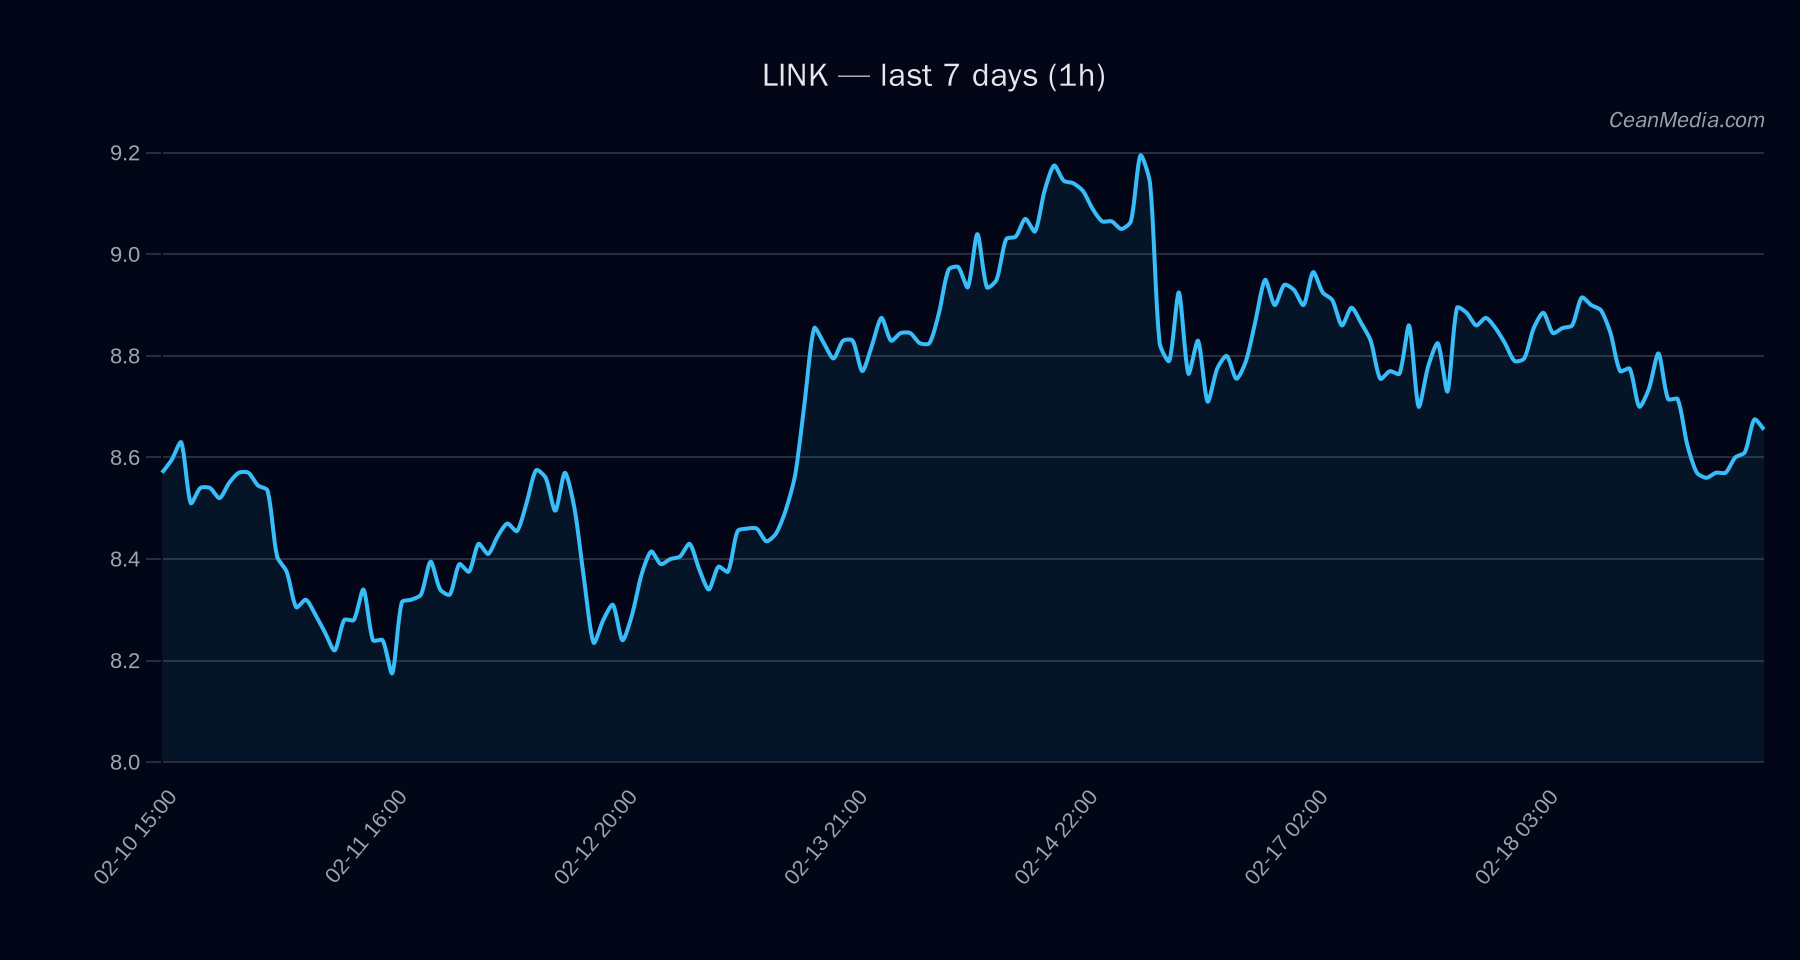
On 2026-02-19, LINK trades near the 8.6 level with near-term downside exposure in the short forecast. Market breadth and volatility indicators point to a low-activity regime, with RSI around 45 and price action contained within established support and resistance bands.
Technical Analysis: LINK
8.67 down (49% probability) EMA12 SMA200 (bullish longer trend), RSI 45 1h close > 8.84 → 9.0203 … 9.1971 1h close < 8.5 → 8.3267 … 8.1567
Forecast: Down with sideways pattern in the near term. Overall momentum signals show limited movement within established bands, with a neutral to slightly bearish tilt.
Drivers
- Return 24h: -0.02
- EMA slope: 0
- Funding Z-score: -2.66
- Basis Z-score: -1.42
- Order-book Imbalance (EMA5): -0.04
- BTC Return 24h: -0.0074
- BTC Vol Regime: 0
- BTC Trend Strength: 0.33
Top drivers indicate modest downside pressure, with negative funding and basis signals contributing to a risk-off tilt within a low-volatility regime. Correlation with BTC remains negative over 72h, though overall breadth remains subdued.
ETF Flows (BTC/ETH)
The ETF flow data provided is limited to BTC and ETH and should be interpreted as context rather than a primary signal for LINK. The reported figures show ongoing outflows in BTC and ETH ETFs over 1D, 5D, and 10D windows, which may reflect shifting risk appetite or hedging dynamics rather than direct implications for LINK pricing.
- BTC ETF: 1D -$49.1M; 5D -$155.5M; 10D -$556.2M
- ETH ETF: 1D -$9.9M; 5D -$77.2M; 10D -$136.9M
Interpretation: The ongoing outflows in BTC and ETH ETFs suggest a cautious or risk-off environment among broad crypto market participants. This context can influence liquidity and sentiment for altcoins like LINK, but should not be used as a primary signal for LINK trading decisions.
What to Watch Next
- Watch for a break above 8.84 to validate a potential move toward 9.02–9.20.
- Watch for a break below 8.50 to signal a move toward 8.33–8.16.
- Monitor BTC ETF flow changes as a secondary gauge of market risk appetite and potential spillover effects.
- Keep an eye on RSI and volatility regime shifts, as a move out of the very low regime could precede larger price action.
Hashtags: #crypto #LINK #marketanalysis #technicalanalysis #ETFlow #BTC #ETH #riskoff #liquidity #altcoins #trading #investing