Market Snapshot
BNB is currently trading around the mid-600s with nearby support at 606–607 and resistance at 649, implying a near-term trading range. The instrument shows a sideways bias with a negative short-term forecast (down) and a low realized volatility regime. Broad market context is characterized by low BTC/ETH vol and mixed breadth signals, with extreme fear still observed in the broader market indicators.
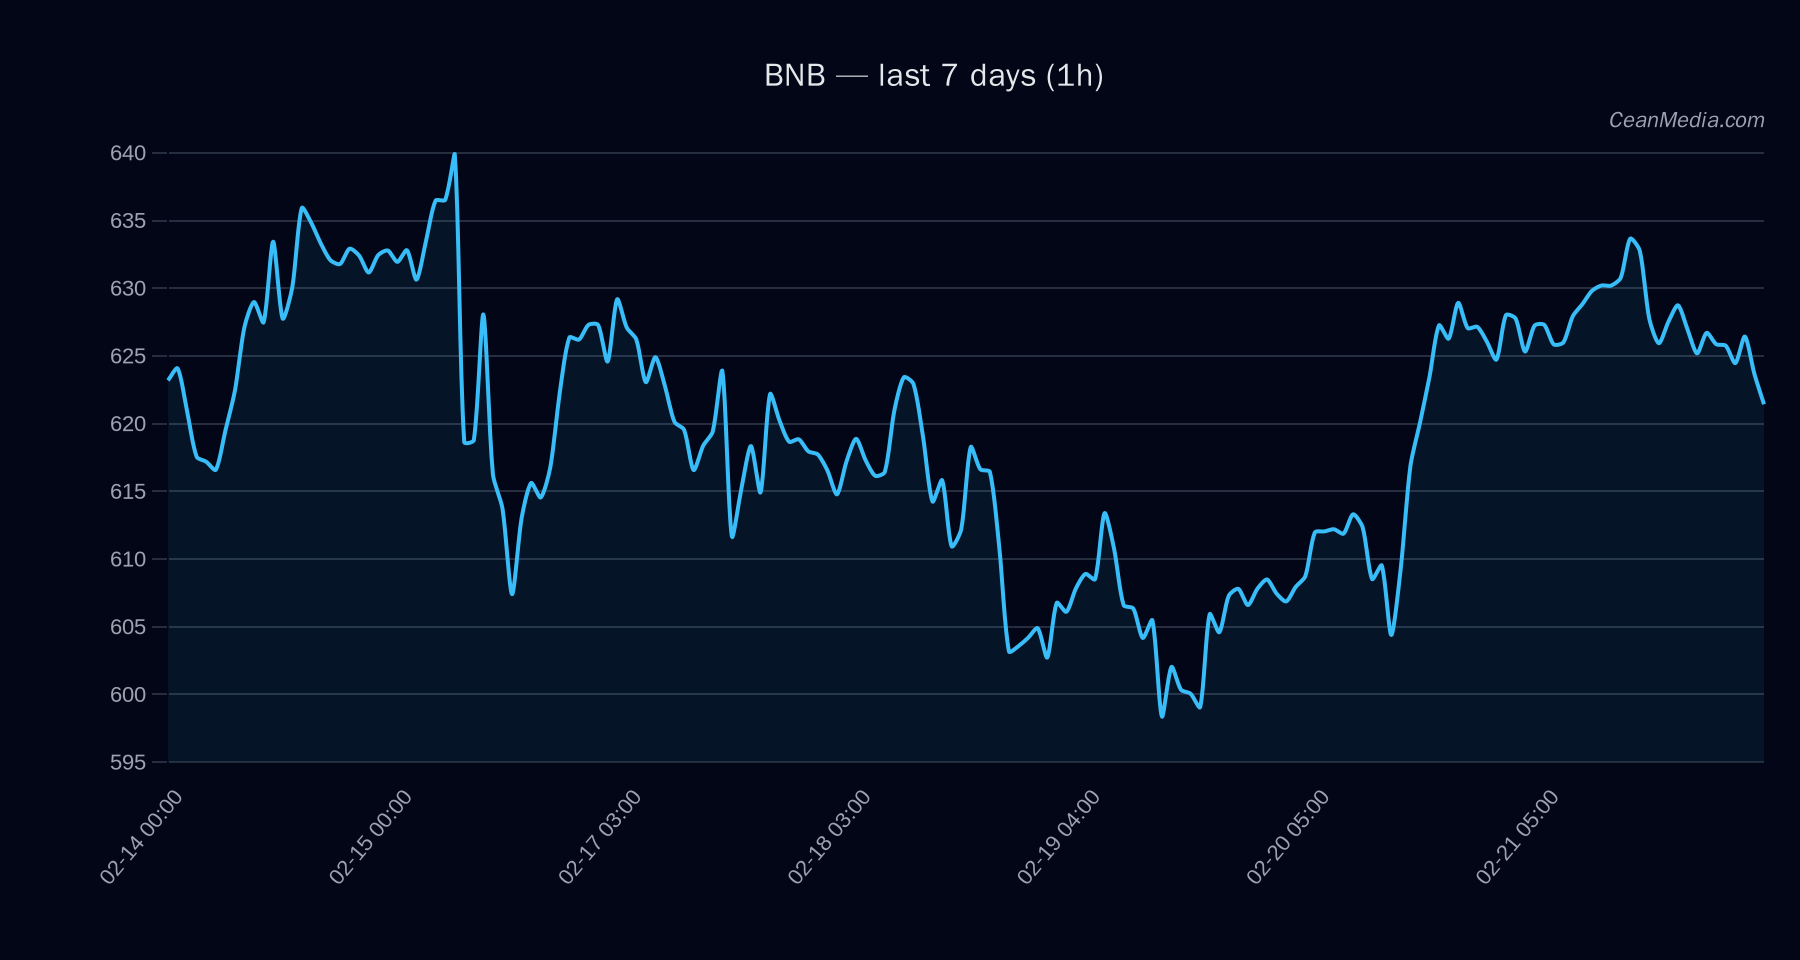
Technical Analysis: BNB
- Price: 619.01
- Bias: Down (47%) with sideways TA attributes
- Key indicators: EMA12 < EMA26; SMA50 > SMA200; RSI 37; 24h σ 0.32%
- RSI: 37 (remains in oversold/neutral zone)
- Support (Major/Near): 606 / 607
- Resistance (Major/Near): 649 / 631
- Band (P20–P80): 609.85 – 638.35
- Forecast: Down with a confirmed sideways context; potential for a break above 631 leading to 644.02–656.65, or a break below 607 leading to 594.50–582.36
- Probability split (24h horizon): Up 39%, Sideways 13%, Down 47%
- Top nuances: Very low volume regime; breadth signals and cross-asset correlations modest
Drivers
- Return 24h: -0.62%
- EMA slope: -0.12%
- Funding Z-Score: 0.67
- Basis Z-Score: 0.62
- Order-book imbalance (EMA5): -0.10
- BTC return 24h: +0.55%
- BTC vol regime: -1 (low/soft regime)
- BTC trend strength: 0.43
ETF Flows (BTC/ETH)
Contextual data show ETF flows are present for BTC and ETH, with BTC ETFs at +$88.1M on the 1D view, but negative over 5D and 10D windows, while ETH ETFs are modestly positive on 1D but negative over longer horizons. It is important to note that ETF data pertains to BTC/ETH and should be viewed as context for risk sentiment and macro liquidity, not as a primary signal for BNB trading decisions.
- BTC ETF: 1D +$88.1M | 5D -$96.9M | 10D -$130.4M
- ETH ETF: 1D +$3.0M | 5D -$91.4M | 10D -$202.8M
What to Watch Next
- Monitor for a close above 631 to validate a potential push toward 644–657 in the near term.
- Watch for a break below 606–607 to assess downside extension toward 594–582.
- Observe changes in RSI as it approaches mid-30s to low-40s for potential momentum shifts.
- Keep an eye on ETF flow momentum in BTC/ETH as a risk-on/off proxy for market liquidity, while recognizing it is not a direct signal for BNB.
Hashtags: #BNBAnalysis #CryptoMarket #TechnicalAnalysis #ETFFlows #BTC #ETH #Liquidity #RiskOn #MarketStructure #Momentum