Market Snapshot
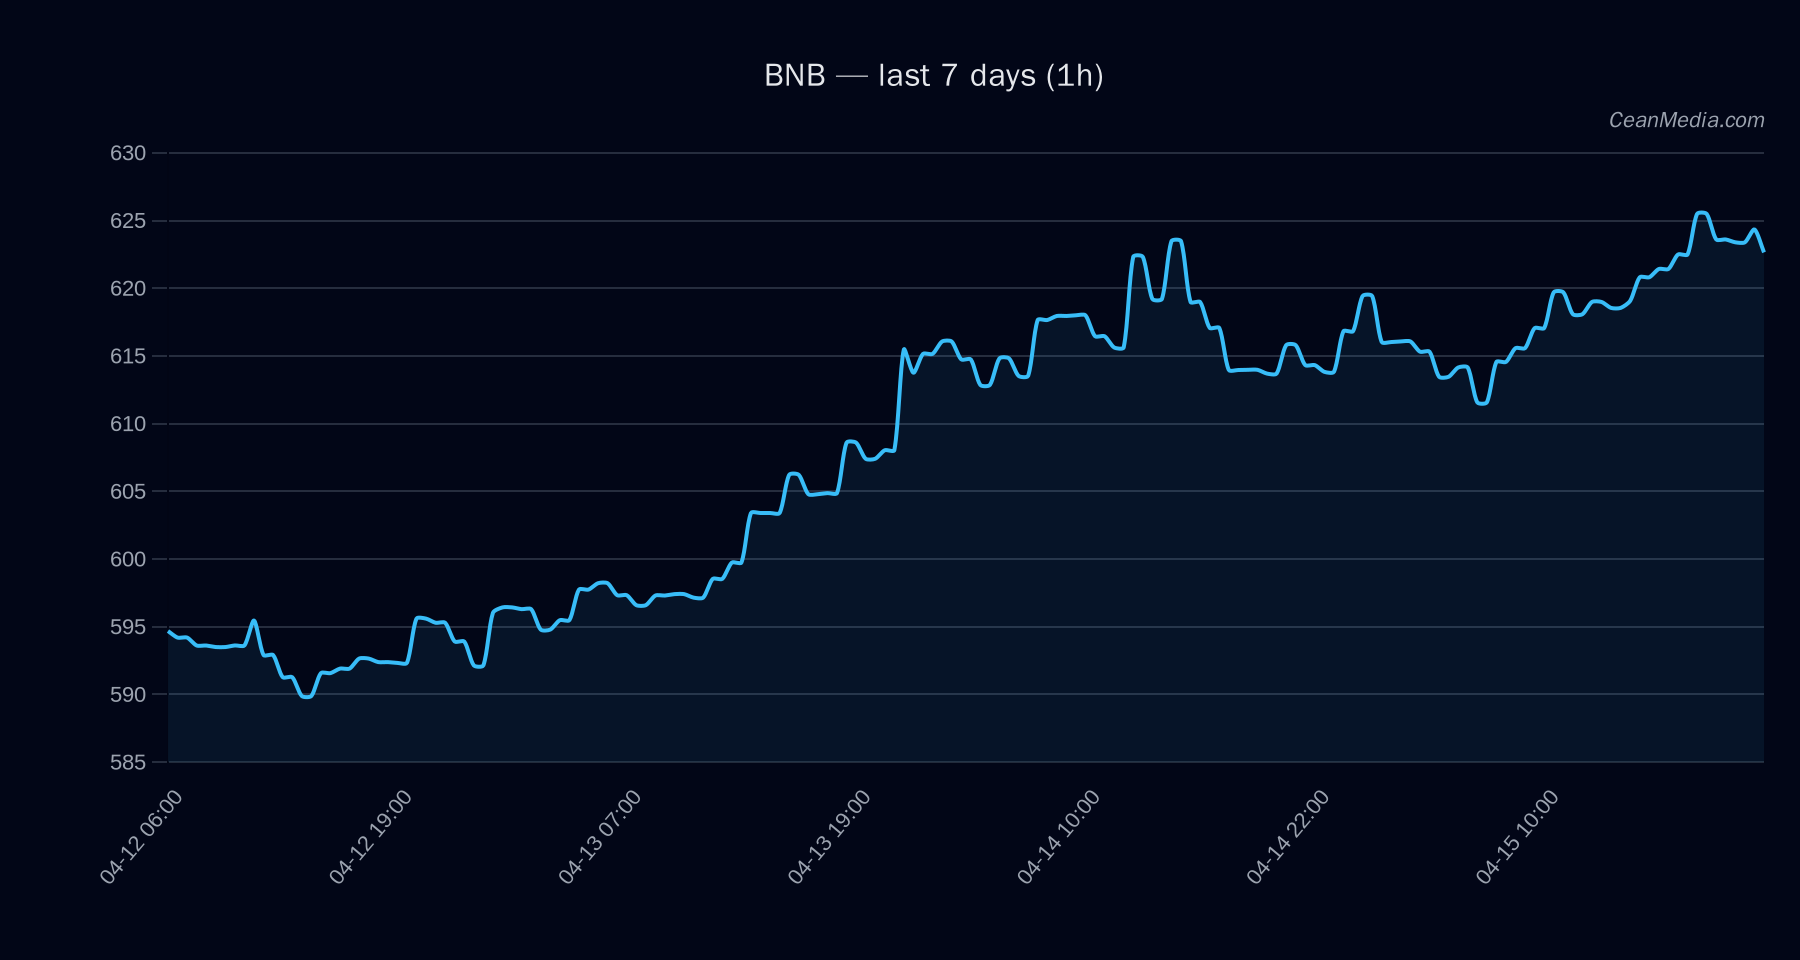
BNB trades around the 620 area with near-term bias tilted higher as of the latest technical view. The price sits between a major support at 591 and a near-term resistance at 617, with a higher-probability upside outlook if the 1-hour close clears 633 to target 645.63–658.29. A close below 608 would shift the scenario toward 595.99–583.82. Market breadth is positive (Breadth>50h: 83%), and overall volatility remains very low, suggesting a cautious, range-bound context rather than a breakout regime.
Technical Analysis: BNB
- Current price: 620.56
- Forecast: Up (probability ~51%)
- Bias indicators: EMA12>EMA26, SMA50>SMA200, RSI 54
- Volatility: σ24h 0.32%, Vol regime: Very low
- Key levels: Support 608 (near), 591 (major); Resistance 633 (near), 617 (major)
- Upside trigger: 1h close > 633 targets 645.63–658.29
- Downside trigger: 1h close < 608 targets 595.99–583.82
- Band/Range: P20–P80: 596.16–630.26; P50: 618.74
- Primary directional read: Short-term bullish with defined resistance to test above 633
- Invalidation: Break below 608 would invalidate the immediate upside bias
Drivers
FUNDING Z-SCORE (3.50), SPREAD BP (0.88), BTC Trend Strength (0.55) Trend strength metric high (0.98) with very low vol regime; RSI neutral at 54 LS TOP Z-SCORE (-1.18), LS GLOBAL Z-SCORE (-1.43) indicate cross-asset dispersion and risk signals
ETF Flows (BTC/ETH)
ETF flow data provided here focuses on BTC and ETH as a contextual backdrop. BTC ETF flows show positive appetite across 1D, 5D, and 10D horizons (1D +$406.5M; 5D +$216.6M; 10D +$771.6M). ETH ETF flows are positive as well (1D +$51.1M; 5D +$58.5M; 10D +$137.3M). This activity signals broader risk-on sentiment and liquidity inflows into BTC/ETH, which can influence correlated altcoins indirectly. It is important to note that ETF data is context and not a primary signal for BNB; the BNB outlook here is derived from internal TA, micro-structure signals, and its own liquidity dynamics.
What to Watch Next
- Watch for a daily close above 633 to validate the upside path toward 645.63–658.29.
- Monitor the 608 level for any breakdown that would shift bias toward 595.99–583.82.
- Observe changes in BTC/ETH ETF flows and overall market breadth, as sustained inflows may support risk-on sentiment and correlate with broader crypto strength.
- Keep an eye on volatility regime shifts; a move from very low to higher vol could affect breakout dynamics and risk management levels.
Hashtags: #BNBAnalysis #CryptoTechnical #MarketSnapshot #ETFFlows #BTC #ETH #Altcoins #CryptoStrategy #TradingView #RiskManagement #MarketOutlook #CryptoNews
Hashtags: #BNBAnalysis #CryptoTechnical #MarketSnapshot #ETFFlows #BTC #ETH #Altcoins #CryptoStrategy #TradingView #RiskManagement #MarketOutlook #CryptoNews