Market Snapshot
\n
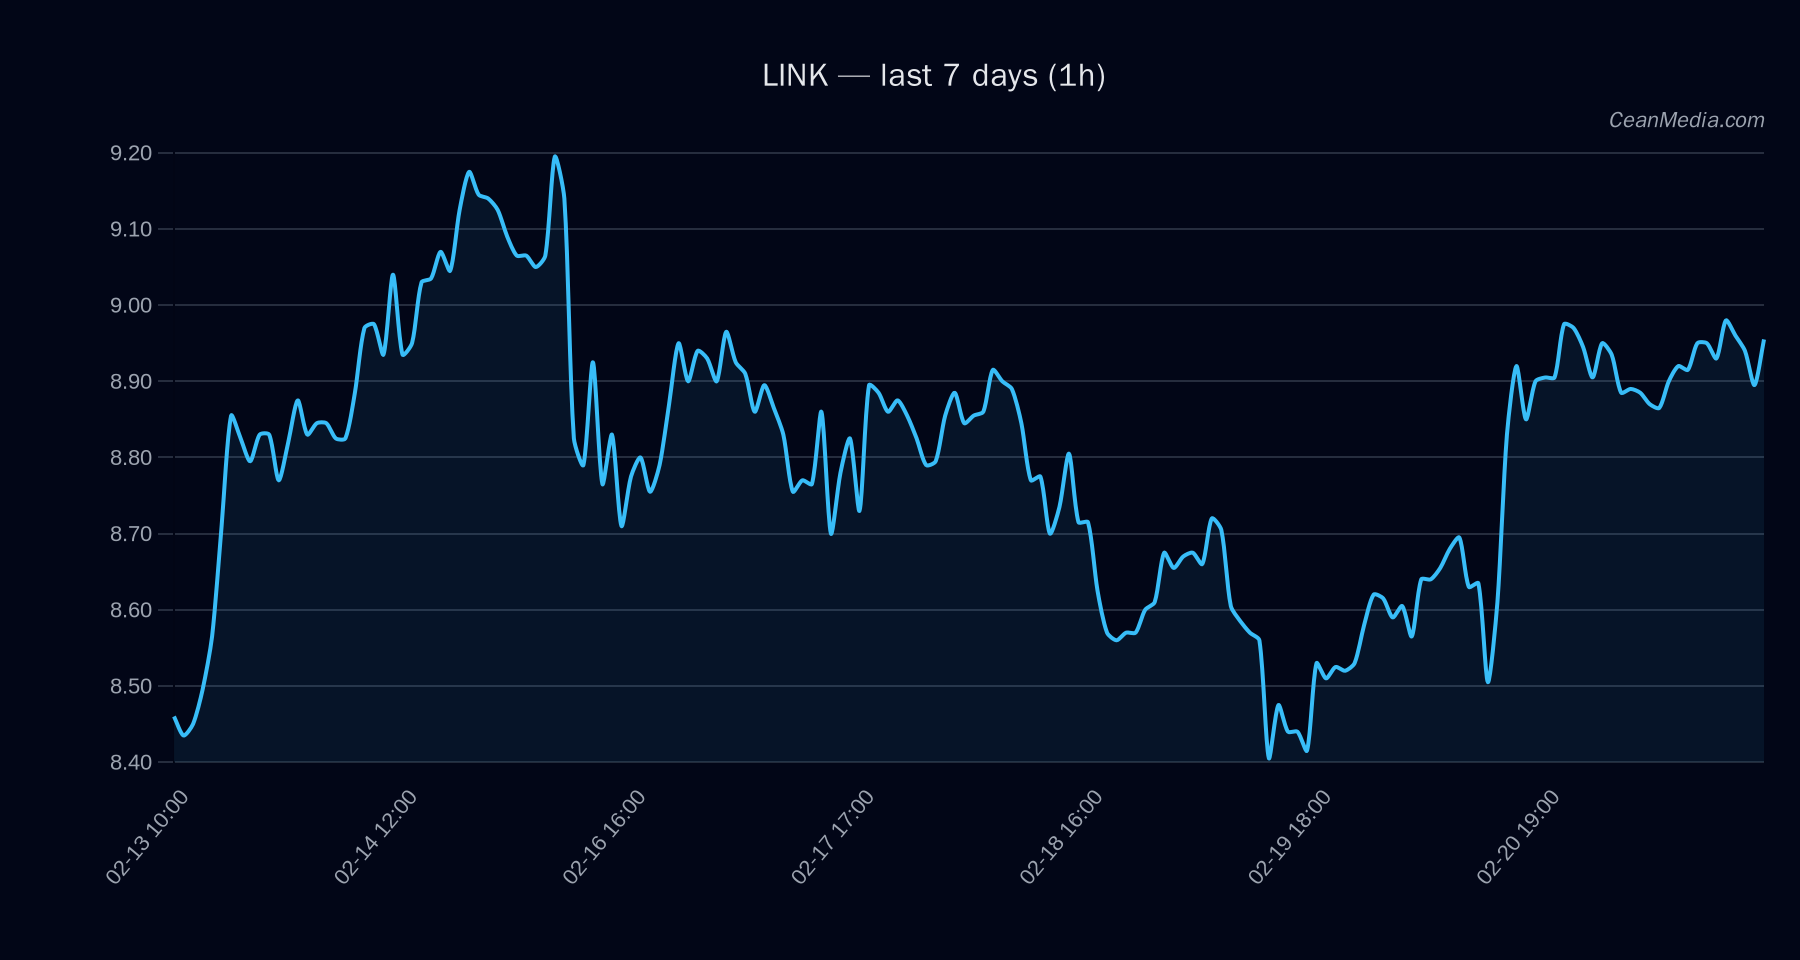
As of the latest read, LINK trades near 8.95. The instrument is contained within a defined range with a major support at 8.80 and a near-term resistance at 9.16. A break above 9.16 would open the path toward 9.34–9.53, while a break below 8.80 would steer toward 8.62–8.45. The short-term forecast is down (54%), with the metric illustrating a mixed but skewed downside bias. Technicals show EMA12 > EMA26, SMA50 > SMA200, RSI at 61, and a volatility regime described as Very Low. Overall, the setup remains neutral on momentum but tilted toward a potential downside in the immediate horizon.
Contextual market breadth is positive (Breadth > 50h: 100%), and the 72-hour correlation with BTC remains modest (ρ ≈ 0.32). The regime signals suggest limited volatility, which can compress price moves around the observed band. The broader market sentiment indicators register Fear/Greed at Extreme Fear, but do not yet imply a definitive trend reversal for LINK absent a clear breakout or breakdown from the defined levels.
Technical Analysis: LINK
: - Support: 8.80 (Near: 8.8); Major: 8.4
- Resistance: 9.16 (Near: 9.16); Major: 9.84
: - Upside trigger: 1h close > 9.16 targets 9.34–9.53
- Downside trigger: 1h close < 8.8 targets 8.62–8.45
- Forecast: Down (54%), with a 39% probability of upside and 7% sideways.
- Range (P20–P80): 8.6936 – 9.8031
- Volatility: σ24h ≈ 0.40%
Drivers
- Return 24h: 0.01
- EMA Slope: 0.0006
- Funding Z-Score: 0.08
- Basis Z-Score: 0.34
- Order-Book Imbalance (EMA5): 0.06
- BTC Return 24h: 0.01
- BTC Vol Regime: -1
- BTC Trend Strength: 0.997
ETF Flows (BTC/ETH)
Contextual flows show BTC-related ETFs with a modest positive tilt on the latest day: BTC ETF +$23.6M, ETH ETF +$1.2M. On a 5- and 10-day basis, BTC ETFs are negative (-$161.4M and -$194.9M respectively) with ETH ETFs also negative (-$93.2M and -$204.6M respectively). It is important to note that ETF data is provided for BTC and ETH only and should be interpreted as context rather than a primary signal for LINK. The current flow pattern suggests a cautious risk-on/off environment rather than a direct directional signal for LINK, given the asset-specific technicals and the lack of a direct linkage in the ETF flow data to LINK’s price action.
What to Watch Next
- Watch for a daily close above 9.16 to confirm a potential move toward 9.34–9.53.
- Monitor a daily close below 8.80 for a tilt toward 8.62–8.45.
- Observe changes in volatility regime; a shift from Very Low could precede tighter ranges or larger moves.
- Keep an eye on BTC ETF flow trends as contextual risk sentiment shifts, though LINK remains primarily driven by its own technicals.
Hashtags: #LINK #CryptoAnalysis #TechnicalAnalysis #BTCFlows #ETFFlows #MarketSnapshot #PriceAction #LiquIDity #TrendFollowing #RiskManagement #MarketStructure