Market Snapshot
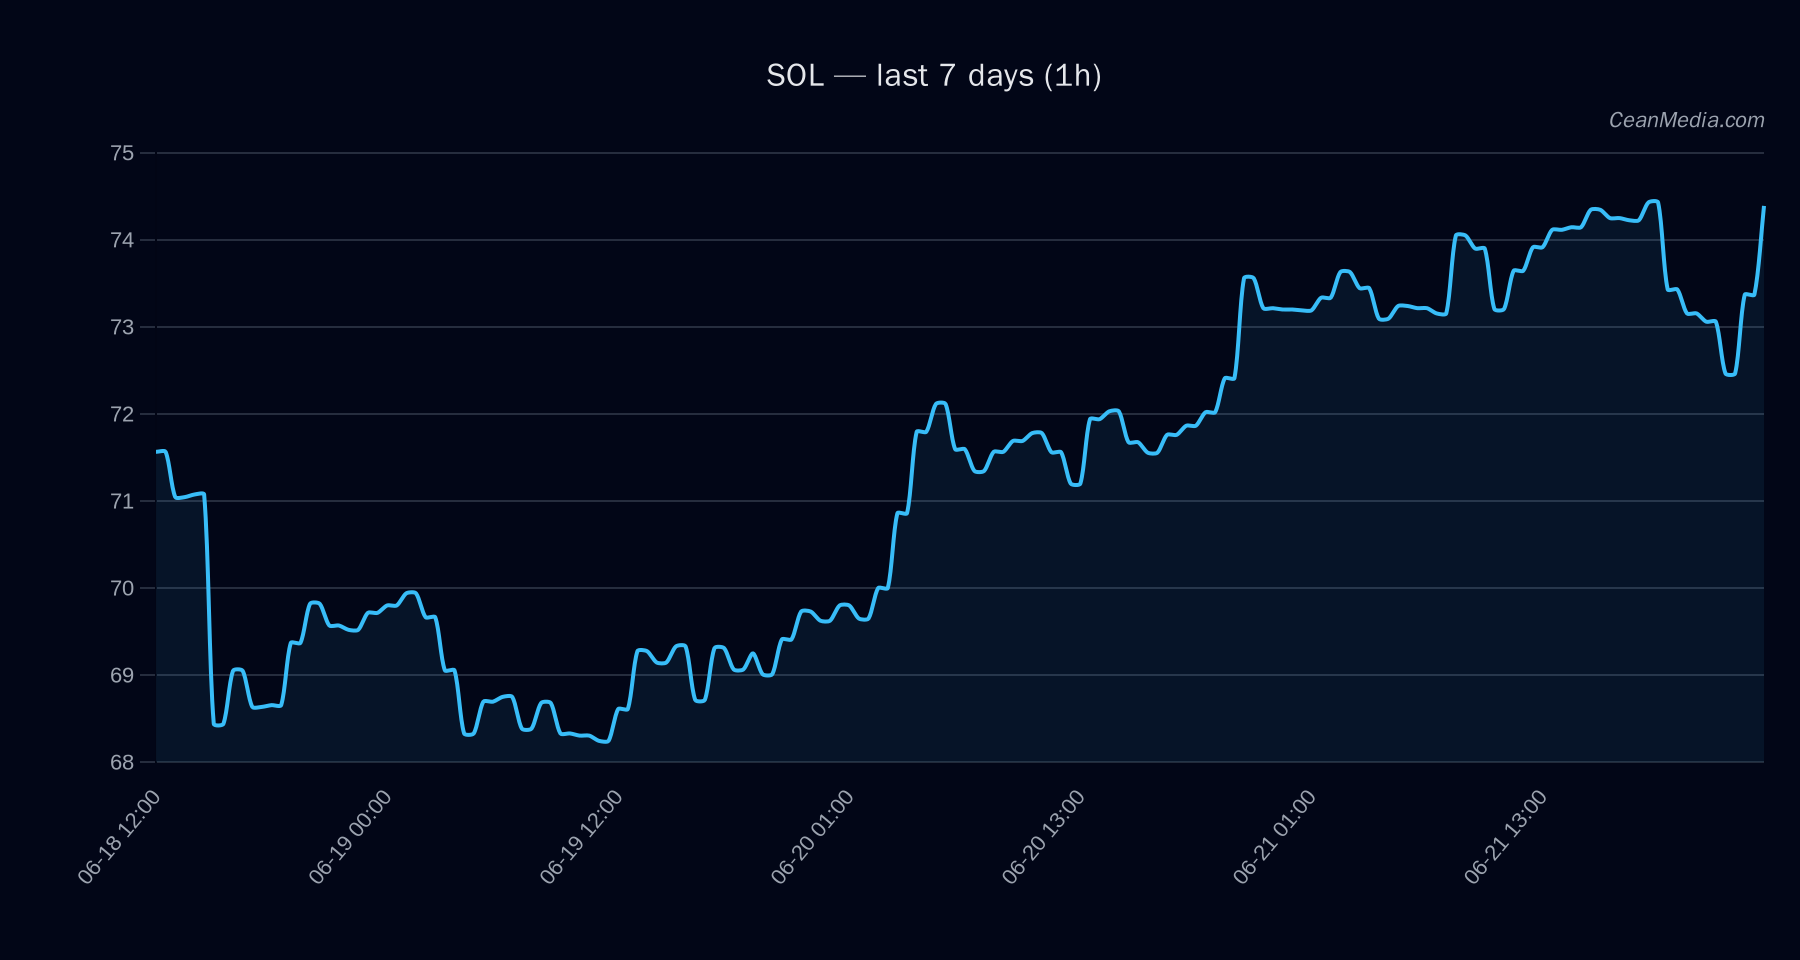
Solana (SOL) trades around the mid-70s, with a close at 74.25. The model indicates a mixed to bullish bias with low conviction (certainty 29/100) and a composite score of +3.7. Data completeness is limited (data missing ~41%), and the snapshot age is effectively current. Top-line warning: evidence alignment is not yet high-conviction; treat direction with caution until trigger confirmations emerge.
Technical Analysis: SOL
+3.7 (conflicts: 1). 74.25. TA trend bullish; RSI 59. EMA12>EMA26; SMA50>SMA200; Volatility sigma 24h 0.62%; very low volatility regime.
63.54 – 83.71 - Up: 1h close > 75.7 → potential move toward 77.25 – 78.76
- Down: 1h close < 72.8 → potential move toward 71.31 – 69.85
Context: Breadth is above 50 hours (67%), BTC correlation over 72 hours is high (0.79). Market breadth and BTC/alt dynamics suggest a cautious tilt, with a risk-on bias in a constrained range.
Drivers
- Top model drivers include: Return 24h, EMA slope, Funding Z-Score, Basis Z-Score, Order-Book Imbalance (EMA5), and BTC 24h return.
- Net momentum indicators show modest negative drawdowns over 30 days and a slight distance from moving average (≈2.76%).
- Vol regime: Very low; Volatility of volatility: near zero; Trend strength: moderate (0.52).
ETF Flows (BTC/ETH)
The provided ETF flows cover BTC and ETH only and are context for market sentiment and risk appetite, not a primary signal for SOL price action. Current frames show:
- BTC ETF: -$90.7M (1D), -$141.6M (5D), +$83.0M (10D)
- ETH ETF: -$12.8M (1D), -$14.9M (5D), +$76.4M (10D)
Interpretation: The BTC/ETH ETF data suggests a risk-off to mixed risk-on backdrop depending on the horizon, with recent net outflows shorter term but some longer-term inflows. This is context for SOL and should not be treated as SOL-specific directional signal.
What to Watch Next
- Watch for a close above 75.7 to validate the near-term upside trigger toward 77.25–78.76.
- Monitor for a break below 72.8 to indicate a potential move toward 71.31–69.85.
- Confirm alignment of signals as data completeness improves (reduce missing data risk).
- Keep an eye on BTC/ETH ETF flow context as a secondary risk indicator for macro sentiment shifts.
Hashtags: #Solana #SOL #CryptoAnalysis #TechnicalAnalysis #MarketSnapshot #ETFFlows #BTC #ETH #CryptoMarkets #Altcoins #MarketSentiment