Market Snapshot
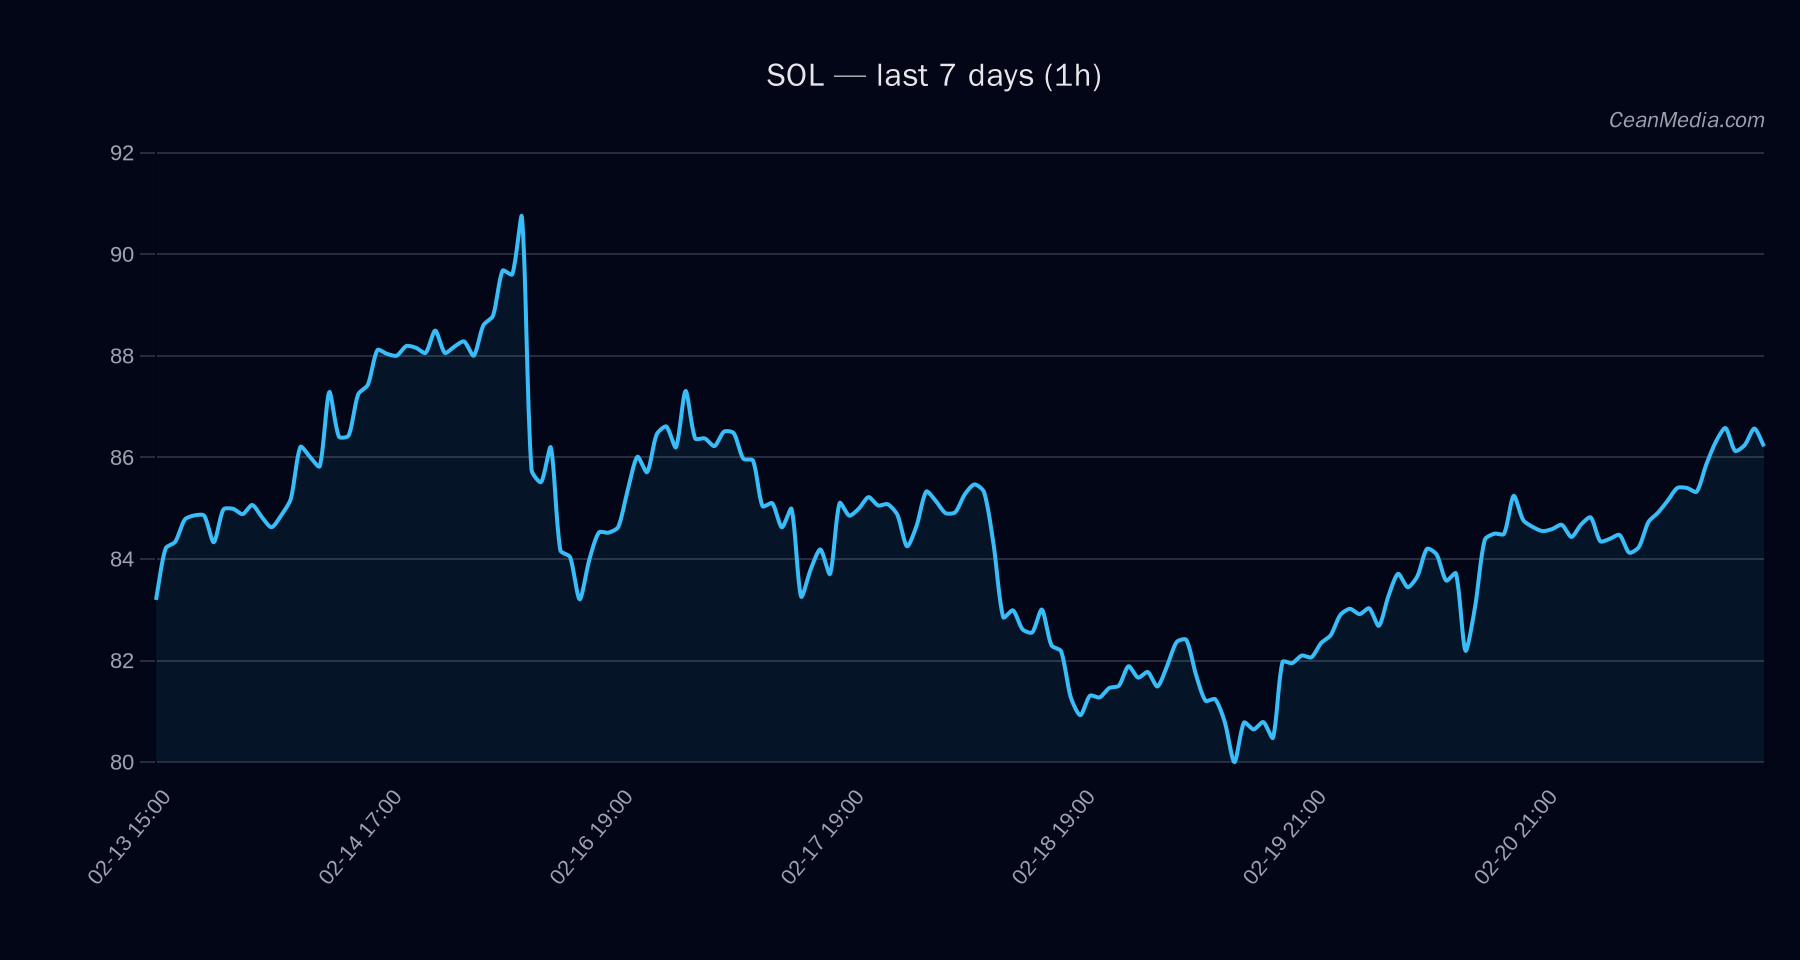
SOL is trading near key support and resistance bounds with a bearish short-term bias embedded in the forecast. The asset sits between major resistance at 90.7 and major support at 80.8, with near-term levels at 87.5 (resistance) and 84 (support). The immediate scenario suggests a down tendency unless there is a breakout above 87.5 or a breakdown below 84, which would shift the projected range toward 89.2–90.97 or 82.36–80.68 respectively. Market breadth and momentum indicators show limited volatility with a very low regime, while RSI sits at 57, indicating room for both upside and downside moves within the established band.
Technical Analysis: SOL
EMA12 > EMA26 and SMA50 > SMA200 indicate a bullish alignment of moving averages despite a bearish short-term forecast (Down 53%). Support 80.8 (major), 84 (near); Resistance 90.7 (major), 87.5 (near). Forecast is Down (53% probability). If 1h close > 87.5, target ranges to 89.22–90.97. If 1h close < 84, target ranges to 82.36–80.68. A sustained move above 90.7 would weaken the downside bias and open the path toward higher levels; a break below the 80.8 support would accelerate a move toward 80.68.
Drivers
- Return 24h: +0.02%
- EMA slope: +0.0008
- Funding Z-Score: 1.11
- Basis Z-Score: 0.23
- Order-book imbalance (EMA5): -0.02
- BTC Return 24h: +0.01%
- BTC Vol Regime: -1 (very low volatility signal)
- BTC Trend Strength: 1.25
Context: Breadth >50h at 100%, alt breadth ex-mega at 100%, vol regime very low, and sentiment indicators suggest cautious positioning. F&G Fear gauge indicates Extreme Fear, and BTC.D remains around 56.5% with slight weekly uptick.
ETF Flows (BTC/ETH)
Contextual note: ETF flow data shown below is specific to BTC and ETH. This information is context for market sentiment and liquidity but should not be used as a primary signal for SOL trading decisions.
- BTC ETF: +$23.6M (1D); -$161.4M (5D); -$194.9M (10D)
- ETH ETF: +$1.2M (1D); -$93.2M (5D); -$204.6M (10D)
The BTC ETF flows indicate short-term bullish liquidity on a daily horizon, but the longer-dated flows show net outflows over 5–10 days. ETH ETF data is smaller in magnitude and follows a similar pattern. Collectively, ETF activity suggests modest risk-off or liquidity shifting in broad crypto markets, rather than a direct SOL signal.
What to Watch Next
- Watch for a close above 87.5 to validate a potential move toward 89.22–90.97.
- Monitor a break below 84 for confirmation of downside acceleration toward 82.36–80.68.
- Observe changes in vol regime and BTC/ETH liquidity signals that could influence broad market risk appetite.
- Keep an eye on RSI and MA alignment for any shift in momentum bias within the current trading band.
Hashtags: #SOL #Solana #CryptoTechnicals #ETFFloWs #BTC #ETH #MarketSnapshot #TradingStrategy #MarketAnalysis #CryptoNews