Market Snapshot
Solana (SOL) is trading around the mid-80s with near-term support at 81.7 and resistance at 85. The current setup shows a bearish tilt on a 24-hour horizon, with a forecasted balance toward sideways-to-down momentum as markets sit in a very low volatility regime. Contextual indicators suggest risk-off sentiment in broader crypto markets, with equities and BTC-related metrics also signaling cautious positioning.
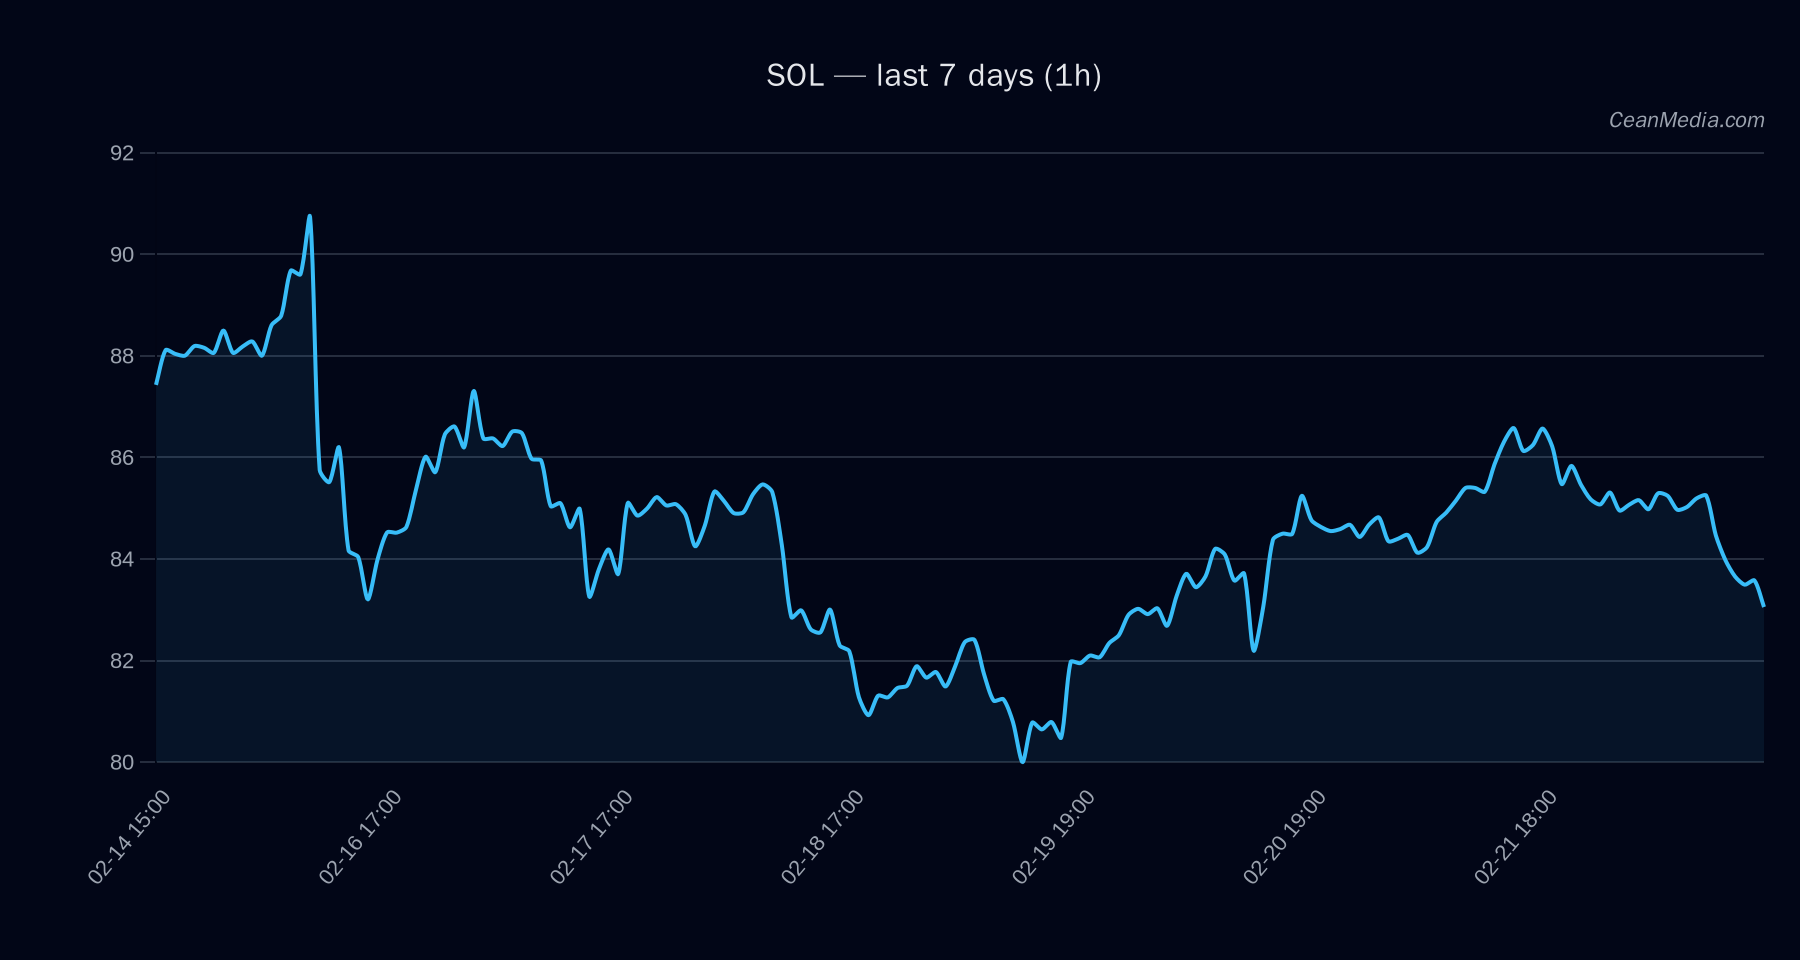
Technical Analysis: SOL
- Current price: 83.35
- Short-Term Forecast: down (53%)
- Probabilities: Up 40%, Side 7%, Down 53%
- Key indicators: EMA12 < EMA26, SMA50 > SMA200, RSI 31, Volatility (σ24h) 0.36%
- RSI: 31 (neutral to oversold range)
- Band: P20–P80 = 82.90 – 86.38
- Support: Major 80.4 | Near 81.7
- Resistance: Major 87.4 | Near 85
- Upside trigger: 1h close > 85 ⇒ 86.72 – 88.42
- Downside trigger: 1h close < 81.7 ⇒ 80.05 – 78.42
Bias and invalidation: Forecast is DOWN with a sideways lean based on EMA relationships (EMA12
Drivers
- Return 24H: -0.04
- EMA slope: -0.0024
- Funding z-score: -0.0617
- Basis z-score: -0.0073
- Order-book imbalance (EMA5): 0.0062
- BTC return 24H: -0.015
- BTC volatility regime: -1 (very low/low volatility)
- BTC trend strength: 1.18
Overall TOP_DRIVERS indicate modest negative momentum with subdued volatility, aligning with a cautious posture for SOL in the near term.
ETF Flows (BTC/ETH)
Contextual ETF data covers BTC and ETH only and is provided as a broader market backdrop. The data is not a primary signal for SOL. Interpretations below are about risk-on/risk-off implications for liquidity and sentiment in the crypto ecosystem.
- BTC ETF: +$88.1M (1D); -$96.9M (5D); -$130.4M (10D)
- ETH ETF: +$3.0M (1D); -$91.4M (5D); -$202.8M (10D)
Net interpretation: Near-term ETF flows show a mixed to cautious stance with modest inflows on a daily basis for BTC but persistent outflows over longer horizons. This pattern can reflect risk-off sentiment and profit-taking in BTC/ETH, potentially constraining broad market risk appetite. While relevant for market context, ETF data should not be used as a primary signal for SOL-specific strategies.
What to Watch Next
- Monitor price action around 81.7–85 to confirm breakout direction or rejection bands.
- Watch for a sustained close above 85 to validate upside targets toward 86.72–88.42.
- Observe RSI movement from the current 31, particularly with any volume uptick, for potential divergence signals.
- Track BTC/ETH ETF flow momentum as a macro risk-on/off proxy, noting any shifts in daily vs. multi-day trends.
Hashtags: #SOL #Solana #CryptoAnalysis #TechnicalAnalysis #ETFFlows #BTC #ETH #RiskOn #MarketSnapshot #TradingStrategy #CryptoNews