Market Snapshot
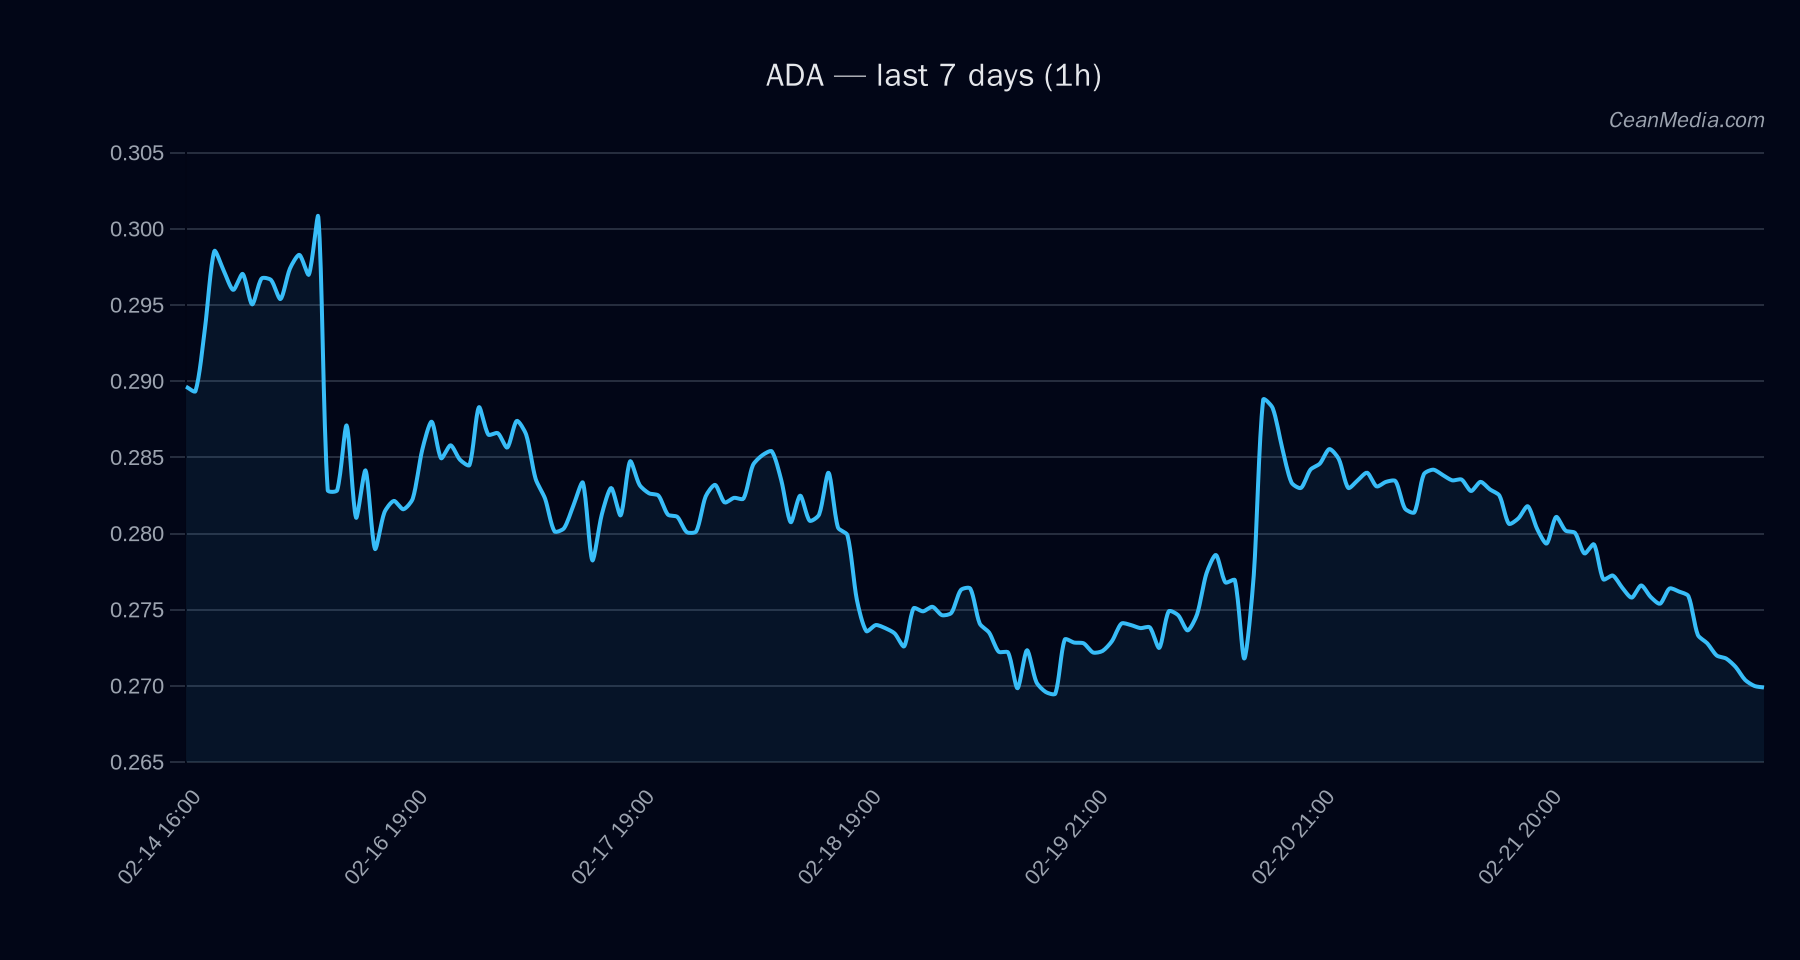
Cardano (ADA) is currently trading around the mid-0.26s, with near-term support near 0.265 and resistance at 0.275. The latest TA indicates a short-term bearish tilt, with RSI deeply oversold and momentum subdued in a very low volatility regime. Contextual market signals include modest 24h price returns and ongoing BTC/ETH ETF flows that may color risk sentiment without directly driving ADA pricing.
Technical Analysis: ADA
- Price: 0.2694
- Bias: Downward in the short term (forecast: down 51%), with sideways undertone suggested by EMA/SMAs configuration (EMA12
- Key indicators:
- RSI: 22 (oversold)
- Volatility regime: Very low (σ24h 0.33%)
- Top momentum drivers: modest negative momentum signals (e.g., EMA slope -0.0018)
- Support / Resistance:
- Major Support: 0.26
- Near Support: 0.265
- Major Resistance: 0.295
- Near Resistance: 0.275
- Forecast scenarios:
- Upside trigger: 1h close > 0.275 → potential move toward 0.2803–0.2858
- Downside trigger: 1h close < 0.265 → potential move toward 0.2587–0.2535
- Overall forecast: DOWN (51%), with a note of sideways TA context implying limited directional momentum in the near term
- Contextual notes: Breadth metrics show Breadth>50h: 0%, BTC correlation (72h) around 0.65, and current BTC-dominance around 56.6% (+0.2%/7d). F&G (Fear/Greed) index reading shows Extreme Fear, aligning with cautious positioning in risk assets.
Drivers
- Top drivers (most impactful): Return 24h (-0.04), EMA slope (-0.0018), Funding Z-score (-0.669), Basis Z-score (-1.68), Order-book imbalance (EMA5) (-0.047), BTC return 24h (-0.016).
- Other notable signals: BTC volatility regime (-1) and BTC trend strength (~1.27), suggesting mixed macro risk sentiment with slight negative tilt for correlated assets.
ETF Flows (BTC/ETH)
The ETF flow data provided covers BTC and ETH exposures and serves as a contextual risk barometer rather than a direct driver for ADA. Key observations:
- BTC ETF: 1D inflow of +$88.1M; 5D flow -$96.9M; 10D flow -$130.4M
- ETH ETF: 1D inflow +$3.0M; 5D flow -$91.4M; 10D flow -$202.8M
Interpretation: The BTC/ETH ETF data indicates modest short-term demand for BTC with net negative longer-term flows, while ETH shows smaller immediate inflows but persistent outflows over longer windows. This pattern aligns with cautious market sentiment and a risk-off tone, which can modestly weight risk assets like ADA to the downside in the near term. It is important to note that ETF data is context and not the primary signal for ADA trading decisions.
What to Watch Next
- Monitor for a close above 0.275 to validate the upside trigger toward 0.2803–0.2858.
- Watch for a break below 0.265 to confirm downside targets around 0.2587–0.2535.
- Keep an eye on BTC/ETH ETF flow shifts as contextual risk indicators, especially if BTC resiliency strengthens or further outflows materialize.
- RSI remains deeply oversold; any sustained move higher would require confirmation from price action and volume, given the very low volatility regime.
Hashtags: #ADA #CryptoMarkets #TechnicalAnalysis #BTCETFFlows #ETH ETF #MarketSnapshot #Altcoins #RiskOnOff #PriceAction #RSI #Volatility