Market Snapshot
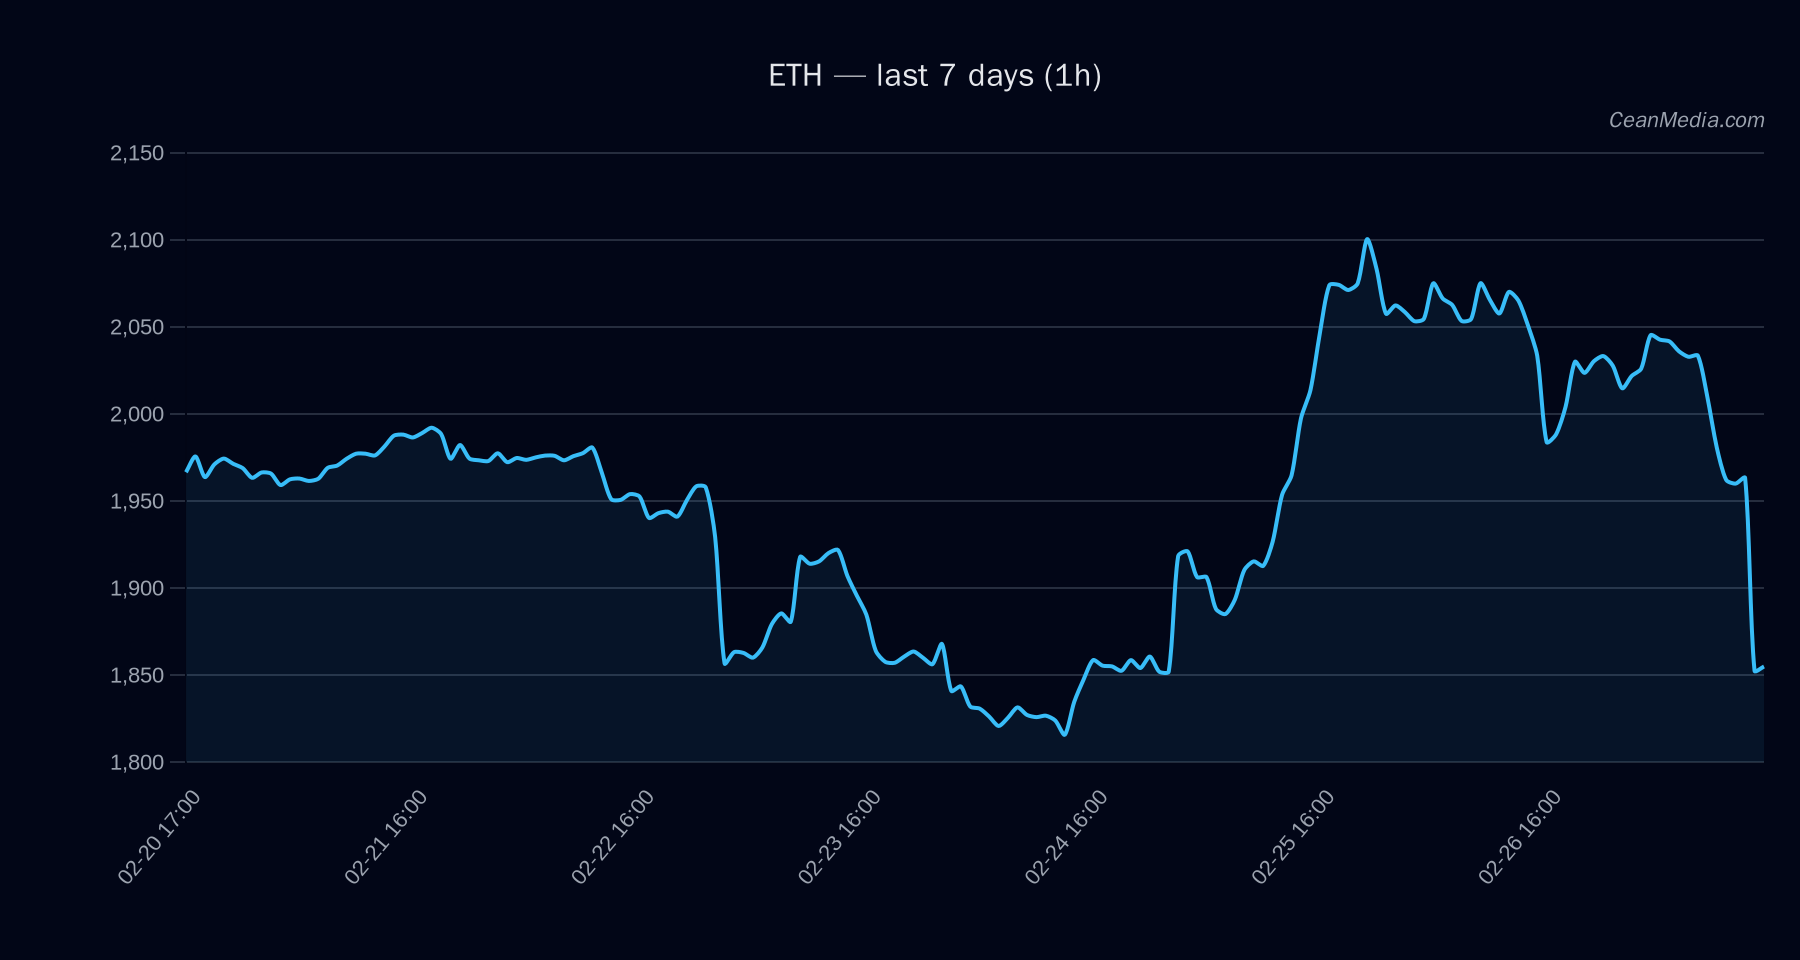
ETH trades around the mid-1,800s with near-term support and resistance in focus. The latest data show a marginally bearish 24-hour return and an RSI in oversold territory, suggesting potential for a short-term rebound if price action breaks key levels. ETF flow data provided here relate to BTC and ETH only and should be interpreted as contextual indicators rather than primary signals for ETH price direction.
Technical Analysis: ETH
: 1,863.6 : up (51%) : P20–P80: 1,780.26 – 1,927.35 : 1h close > 1,900 → 1,938.89 – 1,976.91 : 1h close < 1,826 → 1,789.80 – 1,753.27 : Low; σ24h ≈ 1.35%
Invalidation levels: a move above 1,900 strengthens near-term upside toward 1,938.89–1,976.91, whereas a breakdown below 1,826 increases the likelihood of a pullback toward 1,789.80–1,753.27.
Drivers
- Return 24H: -0.08
- EMA Slope: -0.0094
- Funding Z-Score: -1.8
- Basis Z-Score: -1
- Order-Book Imbalance (EMA5): -0.30
- BTC Return 24H: -0.0549
- BTC Vol Regime: 0
- BTC Trend Strength: 2.23
The ensemble of indicators points to a cautious stance with oversold conditions on ETH suggesting potential for a short-lived bounce if price clears 1,900. The negative funding and balance metrics add to the narrative of limited upside pressure in the immediate term.
ETF Flows (BTC/ETH)
ETF flow data provided here pertains to BTC and ETH only and should be interpreted as contextual signals rather than primary drivers for ETH price action.
: 1D -$27.5M; 5D +$395.5M; 10D +$298.6M - ETH ETF: 1D -$41.7M; 5D +$82.2M; 10D -$9.2M
Interpretation: In the current window, BTC/ETH ETF flows show a mixed or modestly cautious stance, with short-term outflows in ETH and inflows over medium horizons for BTC. This context suggests a general risk-off backdrop rather than a decisive ETH-led momentum signal. ETF data are contextual and not a primary input for ETH-specific trading decisions.
What to Watch Next
- Watch for a daily close above 1,900 as a potential trigger for a move toward 1,938.89–1,976.91.
- Monitor for a break below 1,826 to assess risk of a decline toward 1,789.80–1,753.27.
- Observe changes in RSI, especially moves out of oversold territory that could accompany a rebound.
- Keep an eye on BTC price and ETF flows as contextual indicators, not primary signals for ETH movements.
Hashtags: #Ethereum #ETHAnalysis #TechnicalAnalysis #CryptoTrading #MarketSnapshot #ETFFlows #CryptoNews #PriceAction #RSI #EMASlope #BTC #AltMarket