Market Snapshot
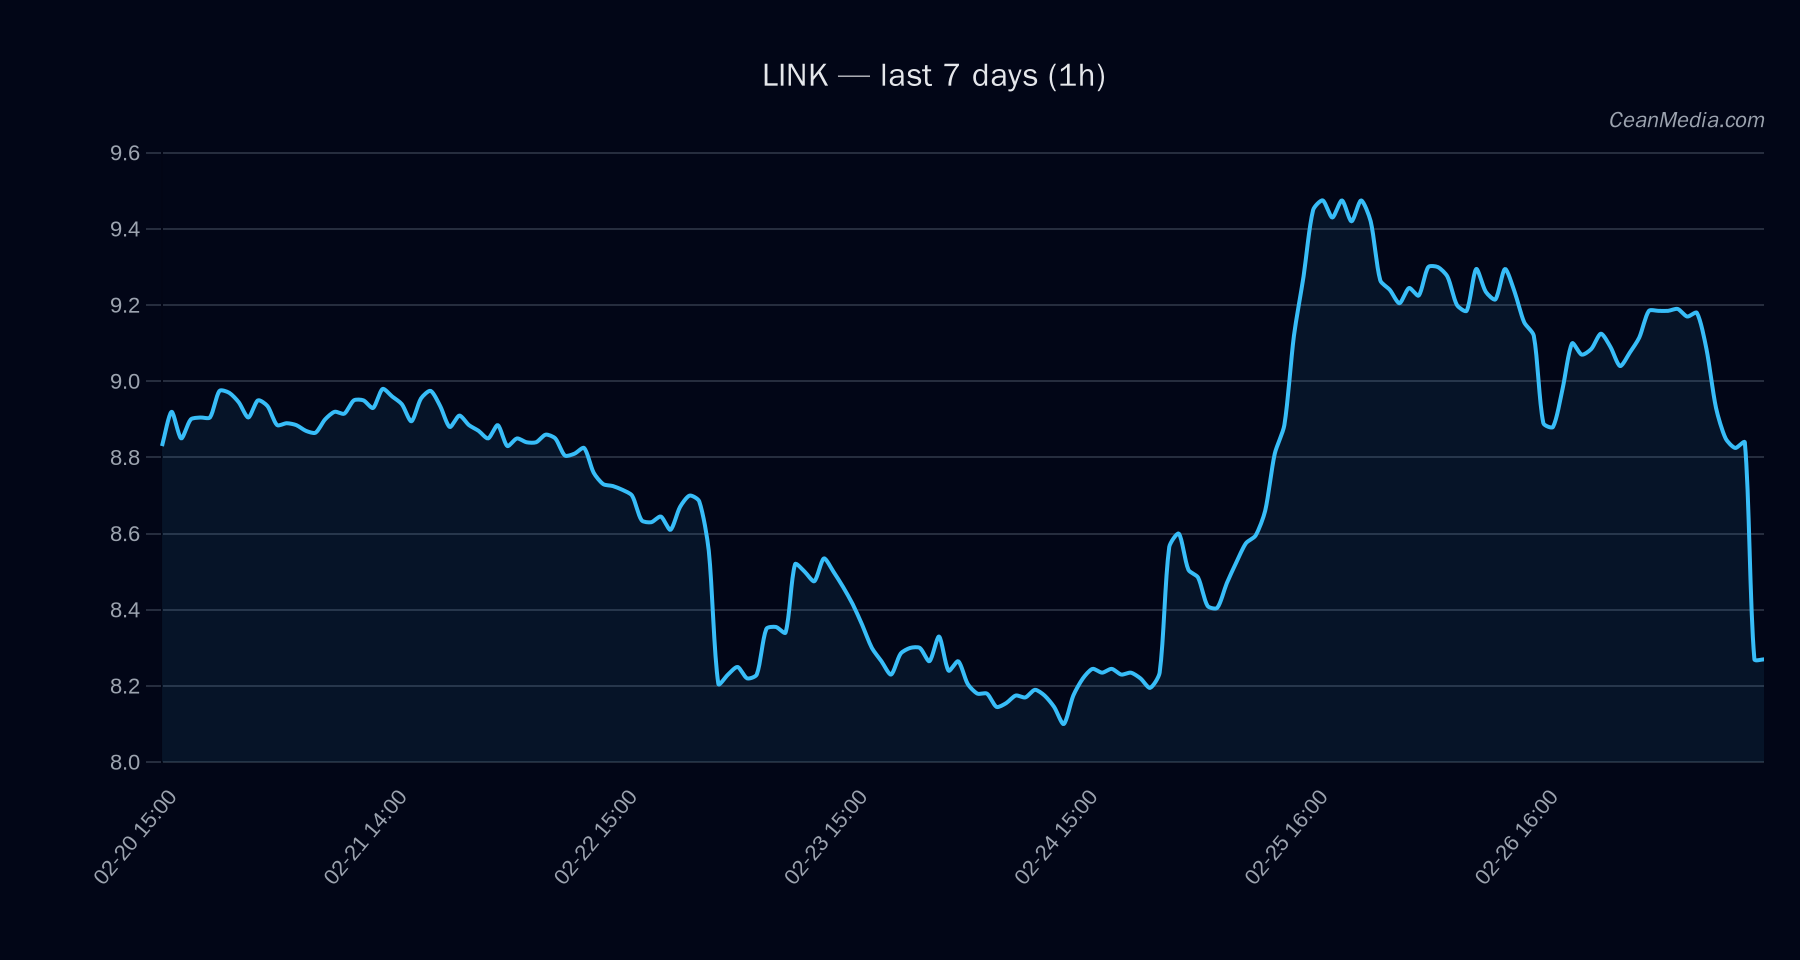
LINK is currently trading around the 8.3 level, with near-term support at 8.14 and resistance at 8.46. The broader context shows a low-volatility regime and mixed momentum indicators, with a tilt toward a potential upside if the price can sustain a break above the near-term resistance.
Technical Analysis: LINK
- Current price: 8.3
- Forecast: Up (50%) with a sideways TA backdrop (EMA12
- Key levels:
- Support — Major: 8.28
- Support — Near: 8.14
- Resistance — Major: 9.12
- Resistance — Near: 8.46
- Projected moves: Upside if 1h close > 8.46 targets 8.6353–8.8046; downside if 1h close < 8.14 targets 7.9713–7.8086.
- Technical context: The pair sits between support and resistance with a bias to the upside on a break above 8.46, while a break below 8.14 would invalidate the near-term bullish bias.
- Key indicators: EMA slope negative, RSI oversold, low volatility regime, BTC-related metrics mixed but not currently decisive for LINK alone.
Drivers
- Top drivers: Return 24h: -0.09; EMA Slope: -0.01; Funding Z-Score: -1.27; Basis Z-Score: -0.51; Order-book Imbalance (EMA5): 0.06; BTC Return 24h: -0.05
- Momentum/Volatility context: Vol regime: Low; BTC trend strength: 2.23; Drawdown and distance-from-MA indicate mixed momentum with a modest tilt to downside risk unless price action breaks above 8.46.
ETF Flows (BTC/ETH)
Contextual ETF flow data is provided for BTC and ETH and is not a primary signal for LINK. Recent observations show:
- BTC ETF: 1D -$27.5M; 5D +$395.5M; 10D +$298.6M
- ETH ETF: 1D -$41.7M; 5D +$82.2M; 10D -$9.2M
Interpretation: The BTC/ETH ETF flows suggest a mixed risk-on/off backdrop influenced by larger crypto market dynamics. However, this data should be treated as contextual rather than primary for LINK-specific trading decisions.
What to Watch Next
- Monitor 1h close above 8.46 for potential confirmation of near-term upside toward 8.6353–8.8046.
- If price breaks below 8.14, reassess risk to the 7.97–7.81 range and adjust positions accordingly.
- Watch for a shift in RSI away from oversold and any change in EMA/SMA cross dynamics (EMA12
- Stay aware of BTC/ETH flow signals as supplementary context, not as a primary decision factor for LINK trades.
Hashtags: #LINKAnalysis #CryptoTrading #TechnicalAnalysis #MarketSnapshot #ETFFlows #BTC #ETH #Liquidity #Volatility #PriceAction #Altcoins #CryptoNews
Note: ETF data provided here is limited to BTC and ETH and is presented for market context only.