Market Snapshot
Bitcoin and altcoin markets continue to show a cautious posture with ADA trading in a tight range. The latest micro-structure data indicate a neutral-to-bearish short-term tilt for ADA, constrained by very low volatility and a conservative momentum profile. ETF flow data for BTC and ETH provide macro-market context but are not the primary signal for ADA’s price action in this article.
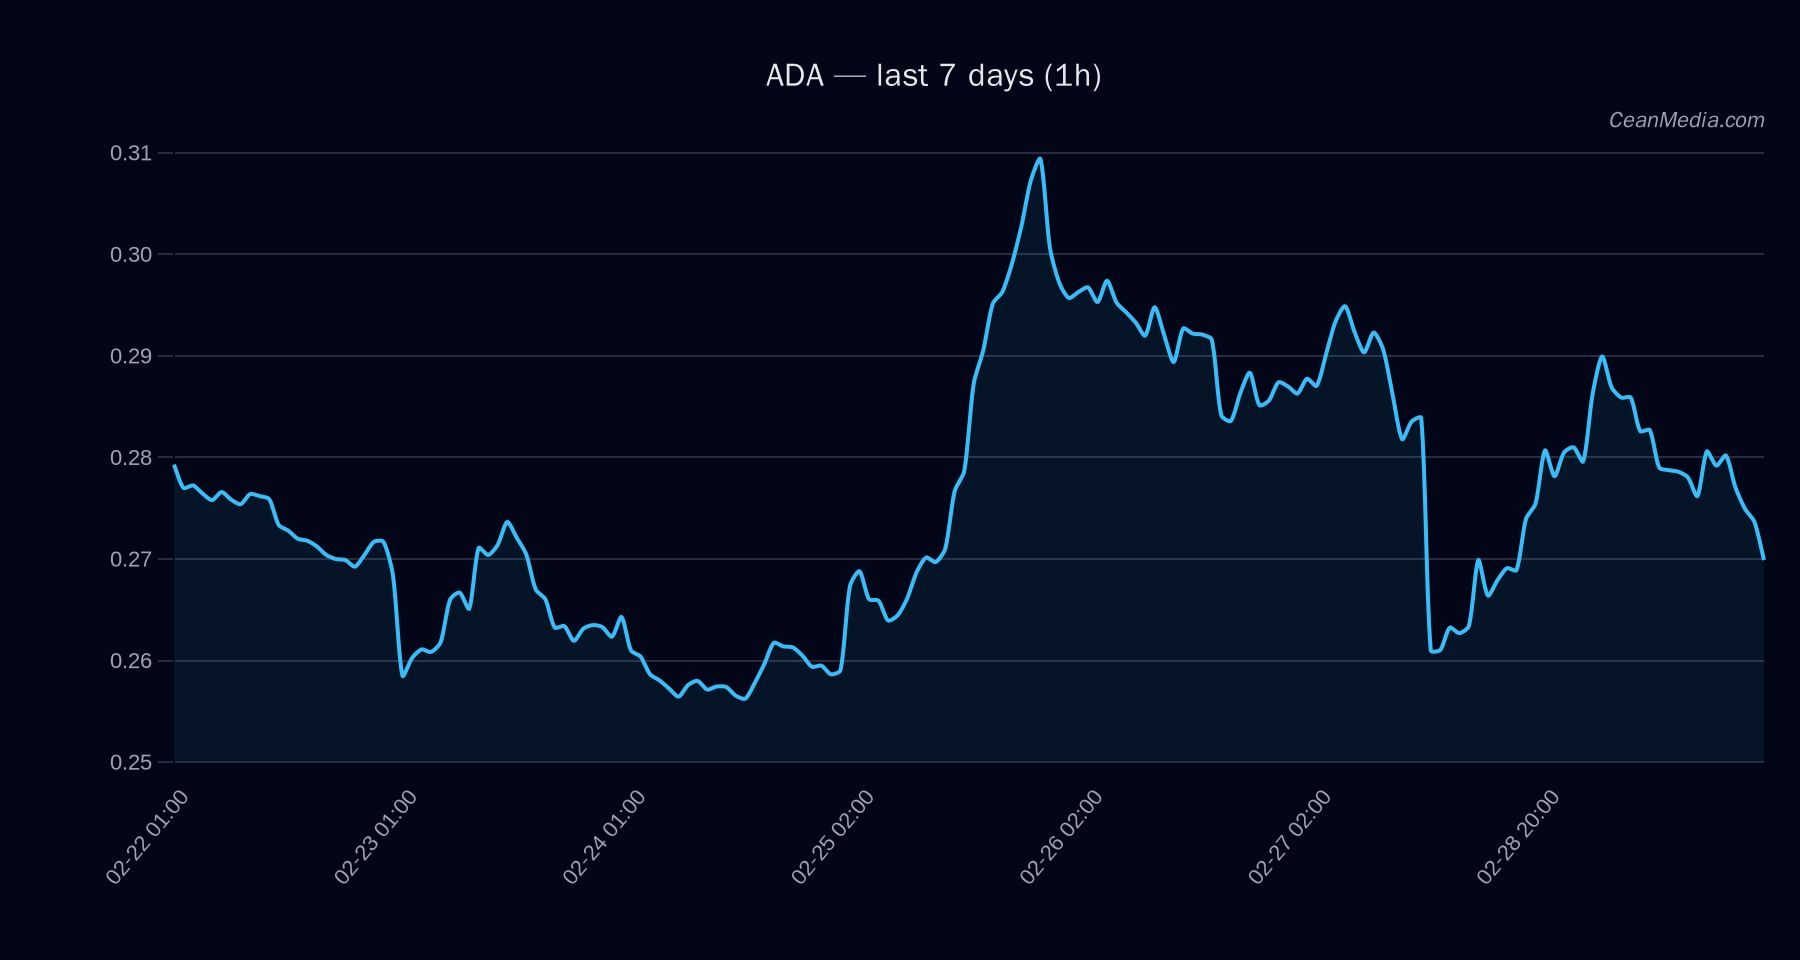
Technical Analysis: ADA
- Price (as of the latest close): 0.2729
- Short-Term Forecast: down (50%)
- Probabilities: Up 41%, Sideways 9%, Down 50%
- Key indicators: EMA12 < EMA26; SMA50 > SMA200; RSI 39; 24h volatility 0.97%; Volume regime: Very low
- RSI: 39 (nearer to oversold threshold)
- Band/Range: P20–P80 = 0.2596 – 0.2842; Major support 0.26; Near support 0.265; Major resistance 0.29; Near resistance 0.28
- Upside/Downside Triggers: Break > 0.28 (near-term upside to 0.2839–0.2895); Break < 0.265 (potential move to 0.2621–0.2567)
- Bias / Profile: Forecast is down; TA indicates sideways movement with subdued momentum (RSI neutral).
- Invalidation: A move convincingly above 0.29 or below 0.26 would alter the immediate bias and broaden the expected move range.
Drivers
- Top factors: 24h return −0.04; EMA slope −0.0045; Funding z-score −0.27; Basis z-score 0.73; Order-book imbalance (EMA5) 0.01; BTC 24h return −0.02
- Momentum/volatility signals: BTC trend strength 0.97 indicates resilient downside alignment in the broader market; vol regime for ADA is very low, reinforcing range-bound dynamics
- Context: Breadth metrics show subdued breadth (Breadth>50h: 0%). F&G fear gauge around extreme fear; BTC.D at 56.1% and drifting lower week-on-week adds nuance to risk-on/off interpretation.
ETF Flows (BTC/ETH)
Context note: ETF flow data provided here relate to BTC and ETH and serve as macro-market context. These signals are not used as primary drivers for ADA price action but can influence the risk environment and cross-asset correlations.
- BTC ETF: 1D −$27.5M; 5D +$395.5M; 10D +$298.6M
- ETH ETF: 1D −$41.7M; 5D +$82.2M; 10D −$9.2M
The ETF data suggest mixed near-term risk-on/off dynamics for BTC/ETH, with short-term outflows and longer-term inflows. In aggregate, this points to cautious risk appetite, which can indirectly influence appetite for altcoins like ADA but should not be treated as a primary signal for ADA trades.
What to Watch Next
- Monitor whether ADA breaks above 0.28 to confirm a near-term upside scenario toward 0.2839–0.2895.
- Watch for a break below 0.265 to validate the downside projection toward 0.2621–0.2567.
- Keep an eye on BTC/ETH ETF flow trends for shifts in risk sentiment that could spill over into altcoin markets.
- Track RSI movement and volume regime changes; a rise in volatility could precede a breakout or breakdown.
Hashtags: #ADA #CryptoAnalysis #Altcoins #MarketSnapshot #ETFFlows #BTC #ETH #TechnicalAnalysis #RSI #EMA