Market Snapshot
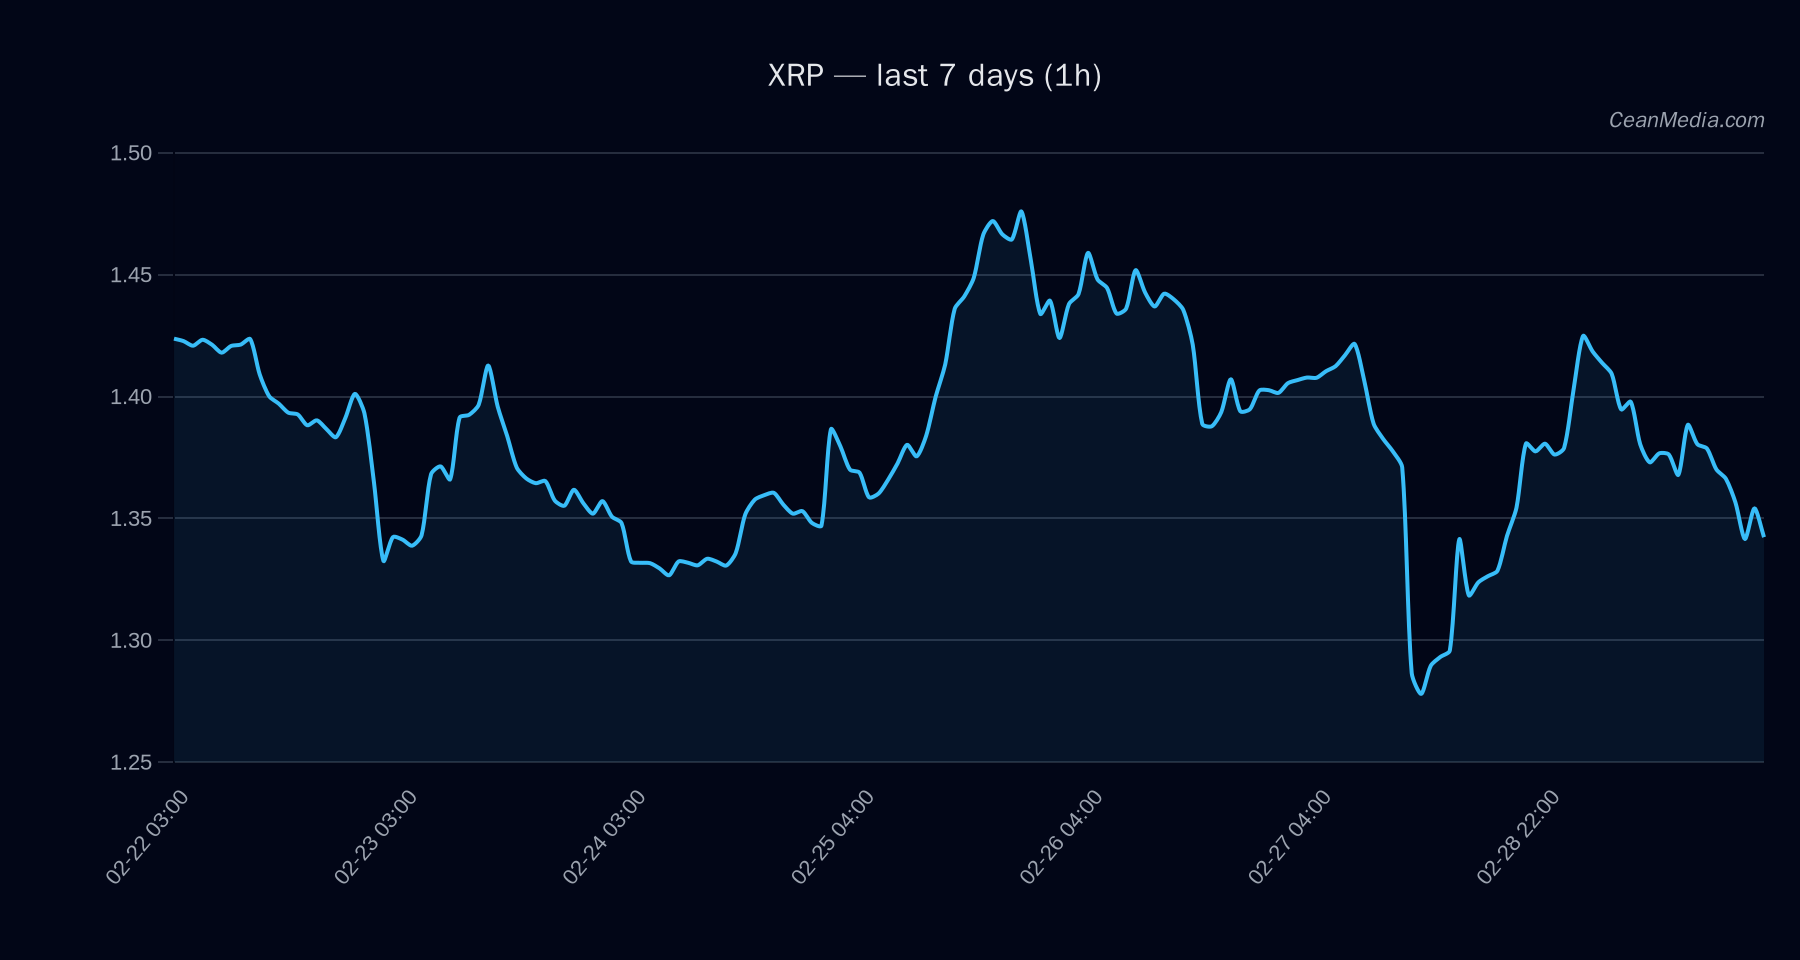
Price ( XRP ): 1.3478. The short-term forecast is bearish with a 56% probability, supported by a bearish setup in the cross- moving averages and a subdued RSI around 41. Price action sits between key levels: support at 1.32 (near) and major support around 1.36, with resistance at 1.38 (near) and major resistance at 1.48. The implied 1-hour breakout targets are 1.4023–1.4297 on a break above 1.38, or 1.2944–1.268 on a break below 1.32. Very low volatility regime and mixed momentum indicators suggest caution around near-term moves.
Technical Analysis: XRP
- Current price: 1.3478
- Bias: Downward / Bearish (short-term)
- Key indicators: EMA12 < EMA26; SMA50 < SMA200; RSI 41; Vol regime: Very low; σ24h ≈ 0.80%
- Support (Major/Near): Major 1.36; Near 1.32
- Resistance (Major/Near): Major 1.48; Near 1.38
- Breakout scenarios: If >1.38, target ranges 1.4023–1.4297. If <1.32, target ranges 1.2944–1.268
- Forecast: DOWN (56% probability); TA bearish signals
- Context: Breadth>50h at 17%; BTC-Dominance trending lower; F&G (Fear & Greed) at 14 (Extreme Fear); BTC.D ~56.1%
Drivers
- Top drivers show modest negative momentum: Return 24h ≈ -0.02, EMA slope ≈ -0.0017, and OBI/EMA5 ≈ -0.057.
- Funding z-score around +0.02 and Basis z-score around -0.82 indicate a slightly negative tilt in price pressure relative to moving averages.
- BTC-related measures: BTC 24h return ≈ -0.02; BTC volatility regime neutral; BTC trend strength ≈ 0.61, contributing to a general risk-off context.
- Overall volatility is very low, and distance from moving averages is negative, reinforcing the downside bias in the short term.
ETF Flows (BTC/ETH)
The ETF flows data provided covers BTC and ETH and is presented for contextual market risk sentiment rather than a direct XRP signal. Summary: BTC ETFs show a net 1D outflow (-$27.5M) but 5D inflow (+$395.5M) and 10D inflow (+$298.6M). ETH ETFs show 1D outflow (-$41.7M) with 5D inflow (+$82.2M) and 10D outflow (-$9.2M). The data suggests intermittent inflows over longer horizons, which may reflect shifting risk appetite rather than XRP-specific catalysts. Do not treat ETF data as a primary signal for XRP trading decisions.
What to Watch Next
- Monitor for a breakout above 1.38 to confirm potential upside continuation toward 1.4023–1.4297.
- Watch for a breakdown below 1.32 to validate the downside targets toward 1.2944–1.268.
- Keep an eye on BTC price action and overall market risk sentiment, given BTC trend strength and the non-trivial relationship with XRP in a risk-off environment.
- Observe changes in volatility regime; a shift from very low to higher volatility could alter breakout probabilities and risk management levels.
Hashtags: #XRPAnalysis #CryptoMarkets #TechnicalAnalysis #ETFFlows #BTC #ETH #MarketSnapshot #TradingStrategy #VolumeAnalysis #RiskManagement #CryptoNews