Market Snapshot
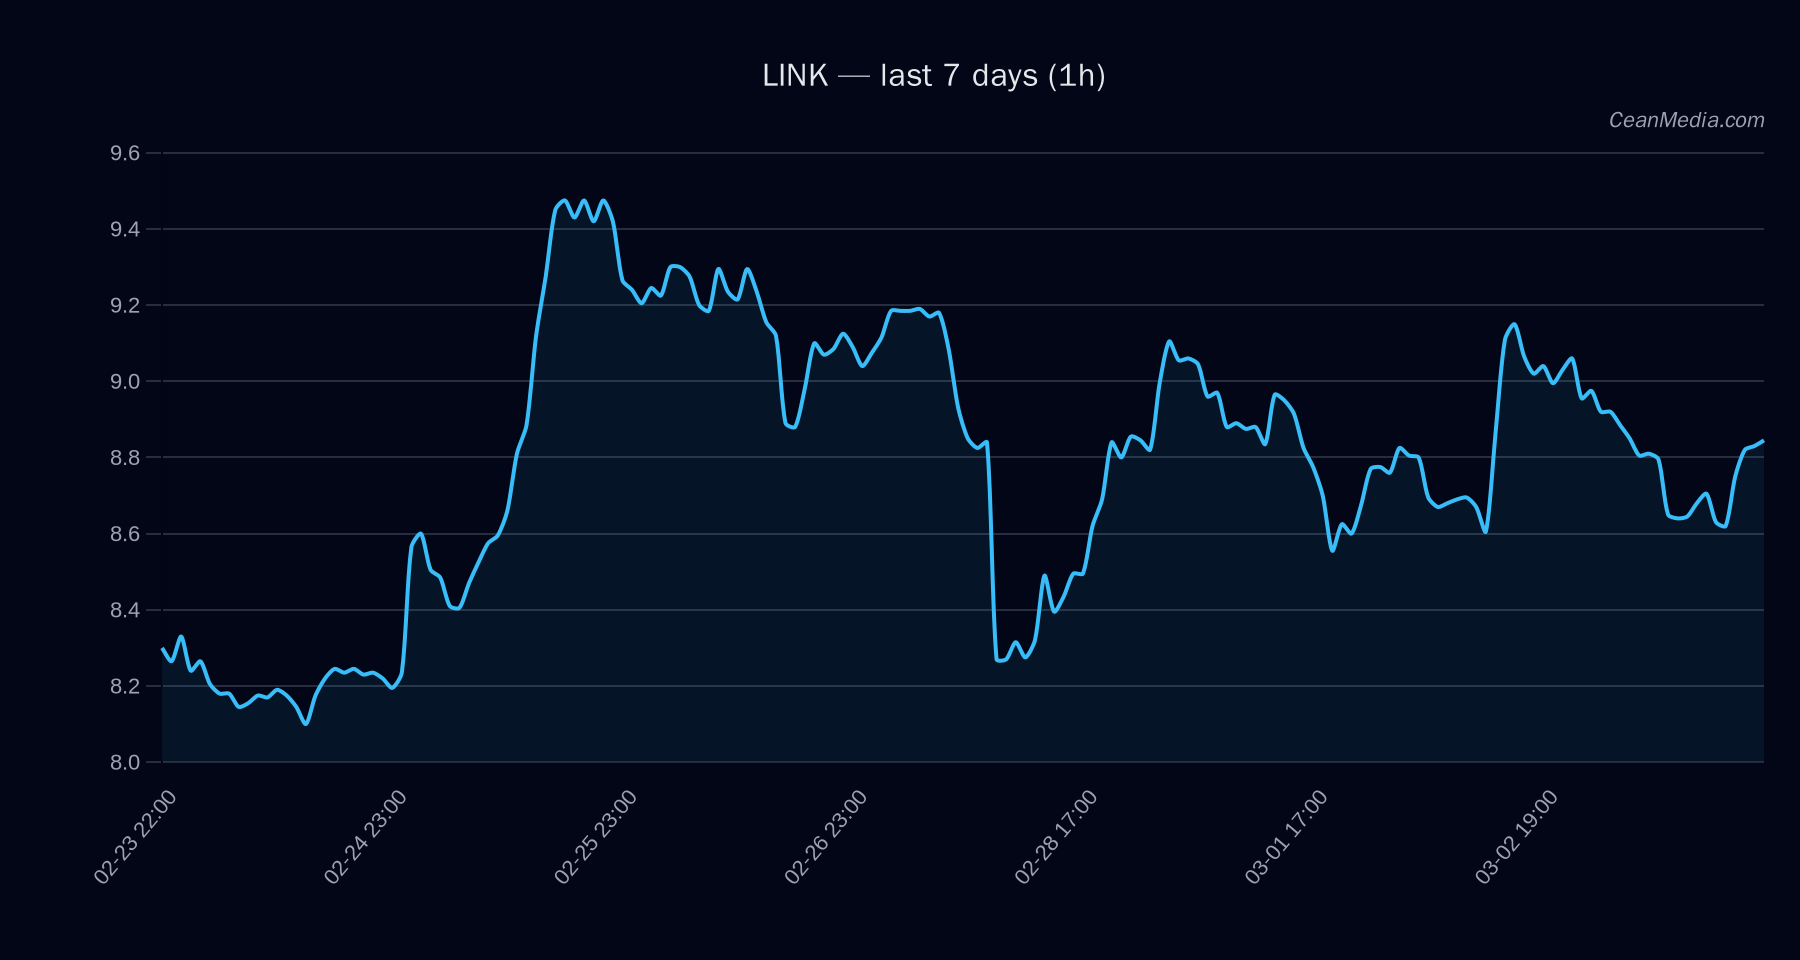
Price: 8.81. The latest technical view for LINK indicates a short-term bias to the downside with a 59% probability, while the overall view remains largely sideways near key levels. Market breadth remains positive (Breadth>50h: 67%), but volatility is characterized as very low.
Technical Analysis: LINK
- Current setup: LINK sits between major support at 8.3 and major resistance at 9.12. Near-term levels: 8.64 support and 8.98 resistance. Break above 8.98 targets 9.1659–9.3456; break below 8.64 targets 8.4611–8.2884.
- Bias and indicators: Forecast: down (59%). TA notes: EMA12 is below EMA26; SMA50 is above SMA200, RSI at 52, and volatility (σ24h) at 0.63% with a very low volume regime. RSI is neutral.
- Probability distribution: Up: 35%, Sideways: 6%, Down: 59%. P50 price: 8.6208. Band (P20–P80): 8.3245–9.2515.
- Key triggers: Upside trigger if 1h close > 8.98 (target 9.1659–9.3456). Downside trigger if 1h close < 8.64 (target 8.4611–8.2884).
- Contextual drivers: 24h return: -0.02, EMA slope: 0.0016, Funding z-score: -1.15, Basis z-score: 0.14, Order-book imbalance (EMA5): -0.02, BTC 24h return: -0.0127, BTC volatility regime: 0, BTC trend strength: 0.395.
Drivers
- Top factors: 24h return (-0.02) and EMA slope (0.0016) indicate mild downside pressure with modest upward momentum risk. Funding z-score (-1.15) and basis z-score (0.14) reflect modest liquidity and valuation signals. Order-book imbalance (EMA5) is negative (-0.015), suggesting selling pressure on recent L2 orders.
- Momentum/volatility: Vol regime is very low, with σ24h at 0.63% and RSI at neutral 52, indicating a choppy but range-bound session ahead. The trend strength metric (~0.62) shows mixed momentum rather than a strong directional move.
ETF Flows (BTC/ETH)
The ETF flow data provided pertains to BTC and ETH and is presented for context. BTC ETF flows are +$195.0M (1D), +$794.3M (5D), +$478.5M (10D); ETH ETF flows are +$29.0M (1D), +$152.7M (5D), +$8.1M (10D). These figures are not a primary signal for LINK but offer macro liquidity and risk-on/off context that can influence risk assets broadly. The data should be interpreted as supplementary context rather than a direct driver for LINK moves.
What to Watch Next
- Monitor 1h close around 8.98 for potential upside continuation toward 9.1659–9.3456 if breached.
- Observe 1h close below 8.64 for potential downside toward 8.4611–8.2884.
- Keep an eye on overall market risk sentiment as BTC/ETH ETF flows suggest liquidity shifts that may impact correlations with LINK during risk-on/off periods.
- Watch for changes in RSI and volume regime signals to confirm a breakout or breakdown rather than rely on a single indicator.
Hashtags: #crypto #LINK #onchain #techanalysis #etfflows #btc #eth #marketcommentary #riskmanagement #cryptomarket #trading #volatility