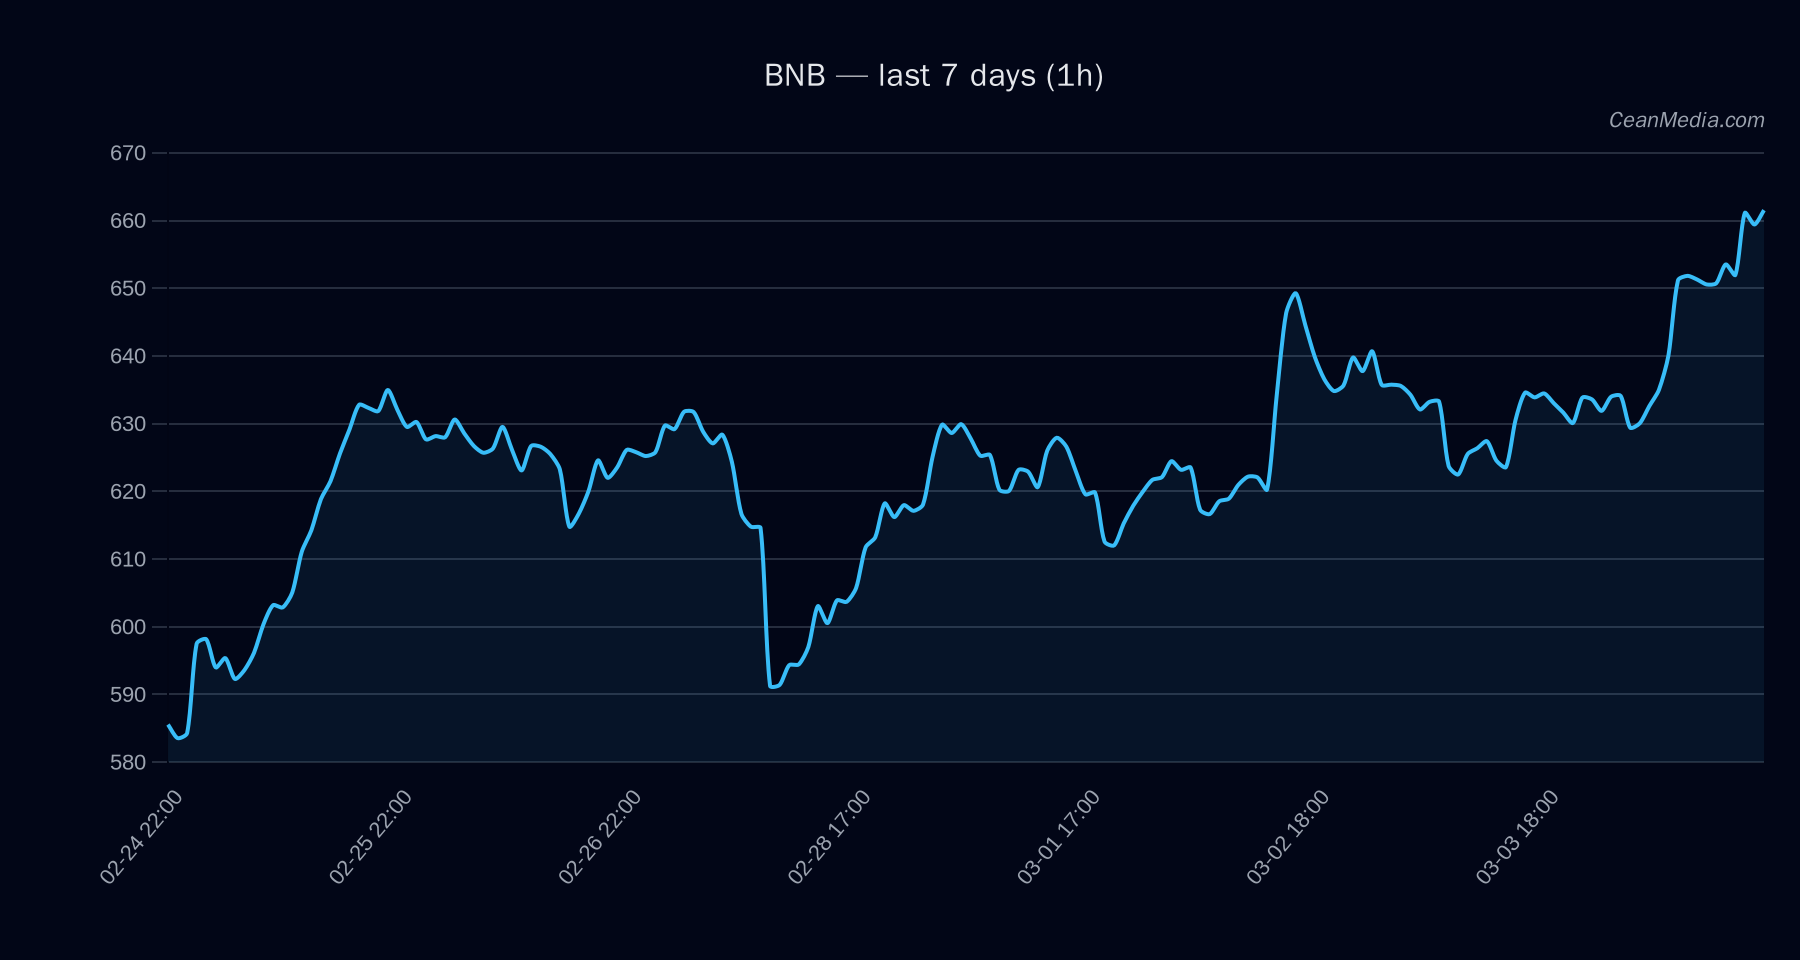
Market Snapshot
BNB has traded around the 650 region with near-term resistance at 677 and support near 650, within a broader band of 652–681. The current price is 663.34, with a short-term forecast skewed to downside (51% probability) despite a bullish technical backdrop (EMA12 > EMA26, SMA50 > SMA200) and a high RSI of 76, indicating overbought conditions on a shorter timeframe. The market is characterized by very low volatility, with a 24-hour sigma of 0.54% and a low-volume regime, suggesting limited participation in the current move.
Technical Analysis: BNB
- Levels
- Near-term support: 650 (major), with a tighter near 617 as a secondary reference.
- Near-term resistance: 677 (major), with an immediate nearby resistance at 634.
- Price band (P20–P80): 652.43 – 681.04; P50 (median): 659.52.
- Bias: Down (51%), driven by a price structure that risks a test toward support if the 650 level is breached, even though the longer-term indicators remain bullish on the moving average cross (EMA12>EMA26, SMA50>SMA200).
- Triggers
- Upside trigger: 1h close > 677 → potential move toward 690.14–703.67.
- Downside trigger: 1h close < 650 → potential move toward 637.07–624.07.
- Invalidation/Notes: RSI at 76 suggests overbought conditions on a short horizon; a sustained break above or below key levels is required to confirm a clear new trend. Overall volatility remains very low, which may limit sustained directional moves without a catalyst.
Drivers
- Return 24h: 0.04
- EMA slope: 0.0027
- Funding z-score: 0.25
- Basis z-score: 0.0087
- Order-book imbalance (EMA5): -0.12
- BTC return 24h: 0.07
: Very low volatility regime; volume is subdued. BTC-related indicators show positive short-term momentum (BTC return 24h and trend strength), but ETF data suggests mixed flows. Market breadth remains robust (Breadth > 50h: 100%).
ETF Flows (BTC/ETH)
Context: ETF flow data here is limited to BTC and ETH only and is intended to provide a broader market risk reference rather than a primary signal for BNB. The BTC ETF shows a near-term withdrawal (-$97.2M) on the 1D horizon, with sizable inflows over 5D (+$518.3M) and 10D (+$366.5M). The ETH ETF registers a 1D outflow (-$52.0M), but positive 5D inflow (+$87.7M) and negative 10D flow (-$71.8M). These patterns can reflect shifting risk sentiment among BTC/ETH holders rather than direct influence on BNB price action.
What to Watch Next
- Monitor 650 support and 677 resistance for potential breakout or breakdown signals.
- Observe price action near P20–P80 band (652–681) for validation of the current range bias.
- Watch RSI behavior near overbought territory in combination with volume spikes for potential reversal cues.
- Keep an eye on BTC-related flows and overall ETF signal context as a risk-on/off backdrop, while recognizing these are contextual rather than primary drivers for BNB.
Hashtags: #BNB #CryptoAnalysis #TechnicalAnalysis #BTC ETFFlows #ETH ETFFlows #MarketSnapshot #TradingStrategy #CryptoMarkets #Altcoins #EMA #RSI