Market Snapshot
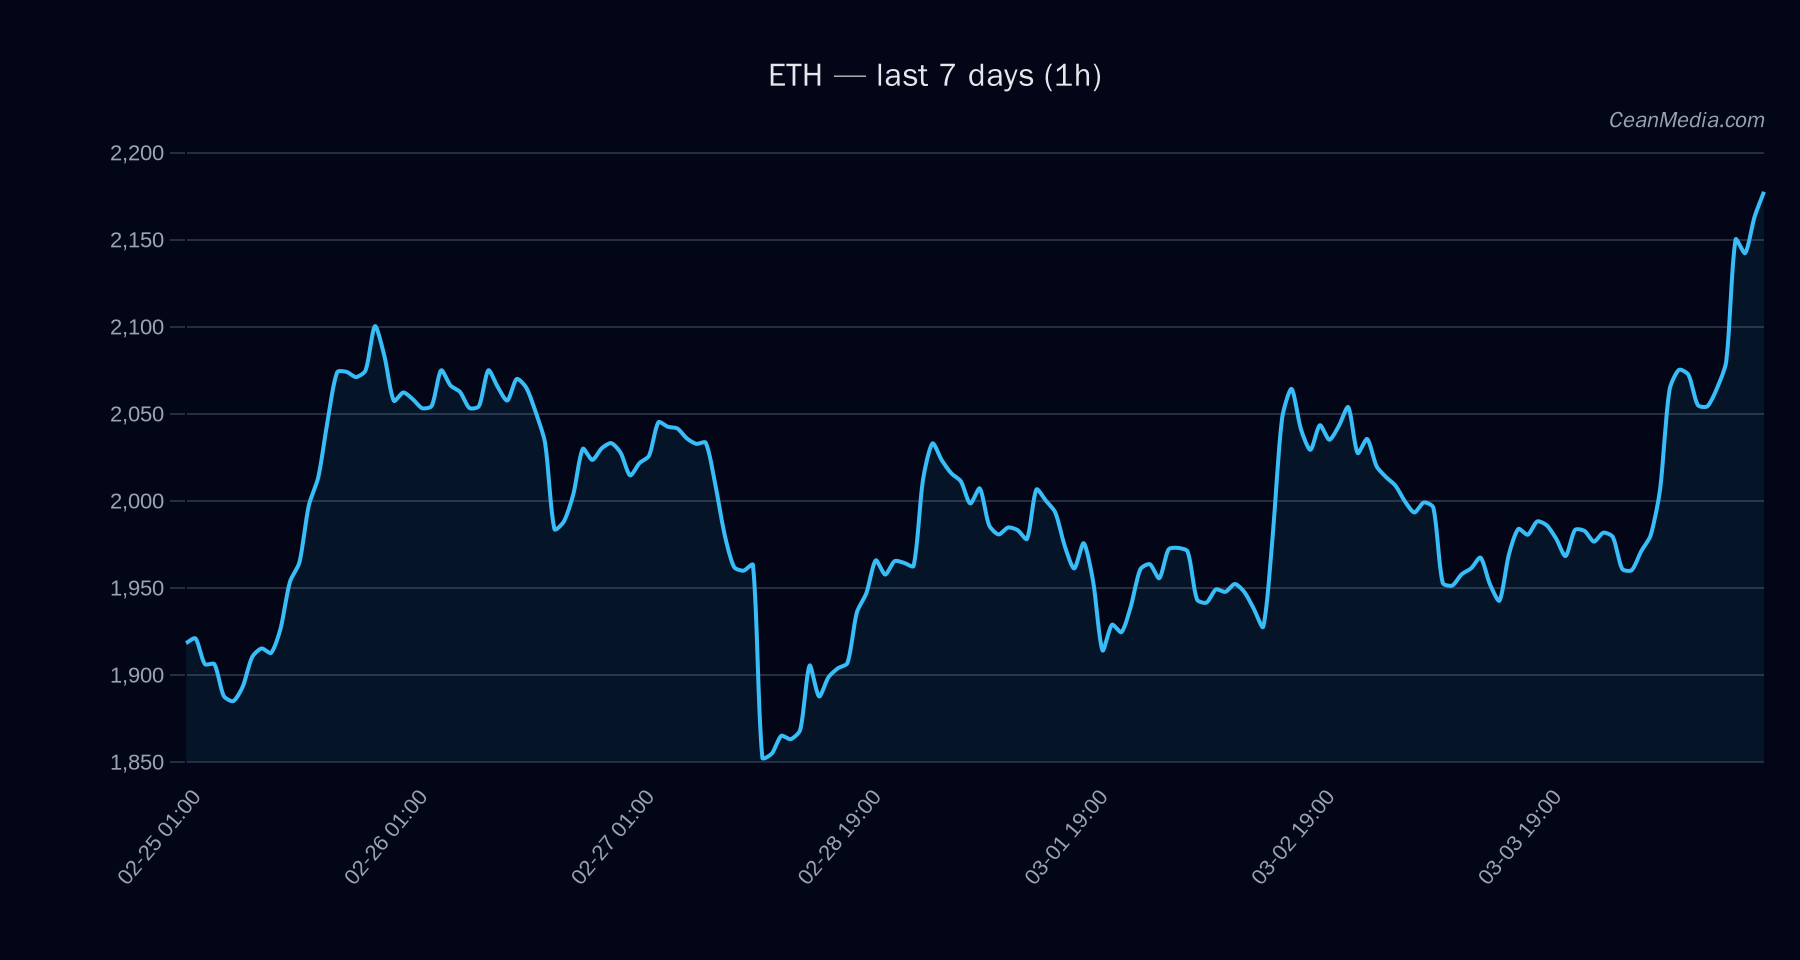
ETH traded around the 2,157 level with a near-term bias to the downside according to the latest reading. The instrument sits between key support and resistance bands, and is influenced by a low volatility regime alongside a high relative strength index (RSI) near overbought territory.
Technical Analysis: ETH
- Current price: 2,157.23
- Short-Term Forecast: Down (65%)
- Probabilities: Up 28%, Sideways 6%, Down 65%
- Key indicators: EMA12 > EMA26, SMA50 > SMA200, RSI 76 (overbought), 24h volatility ~1.00%
- Trading band: P20–P80 = 2,072.38 – 2,253.27
- Major support: 1,872; Near support: 2,114
- Major resistance: 2,064; Near resistance: 2,200
- Upside trigger: 1h close > 2,200 ⇒ 2,244.38 – 2,288.39
- Downside trigger: 1h close < 2,114 ⇒ 2,071.80 – 2,029.52
- Bias: Neutral-to-bullish trend indicators (EMA cross, momentum signals) with current RSI signaling caution due to overbought readings
Drivers
- Return over 24h: +0.10%
- EMA slope: +0.0069
- Funding Z-score: +1.52
- Basis Z-score: -0.46
- Order-book imbalance (EMA5): -0.02
- BTC 24h return: +0.08%
- BTC volatility regime: Low
- BTC trend strength: 1.92
- Other momentum: distance from MA 0.076 (2–3% band), drawdown 30d around -28.4%
ETF Flows (BTC/ETH)
Contextual data shows BTC and ETH ETF flows, which can reflect broader risk appetite but should not be treated as primary signals for ETH pricing. The data below is BTC/ETH-focused and should be considered alongside price action and microstructure signals.
- BTC ETF flows (1D): -$97.2M
- BTC ETF flows (5D): +$518.3M
- BTC ETF flows (10D): +$366.5M
- ETH ETF flows (1D): -$52.0M
- ETH ETF flows (5D): +$87.7M
- ETH ETF flows (10D): -$71.8M
The ETF data suggests a mixed backdrop: short-term outflows in ETH and modest positive sentiment in BTC on multi-day horizons. This aligns with a cautious stance for ETH while market participants observe broader risk-on/off dynamics. It is important to reiterate that ETF data is context, not a primary signal for ETH pricing.
What to Watch Next
- Watch for a sustained close above 2,200 to shift probabilities toward the upside targets near 2,244–2,288.
- A break below 2,114 would open a path toward 2,071–2,030 in the near term.
- RSI remains in overbought territory; monitor for a potential consolidation or pullback that could reset momentum.
- Keep an eye on BTC strength and volatility regimes as they tend to correlate with ETH price action in this market context.
Hashtags: #ETHTechnicalAnalysis #ETHForecast #ETFFlows #CryptoMarkets #RSI #EMAs #PriceAction #MarketSnapshot #CryptoTrading #BTCETHFlows