Market Snapshot
On 2026-03-07, Cardano (ADA) trades around the sub-$0.26 region with a short-term bearish tilt. The current price is approximately 0.2595, sitting within a tight range near near-term support and resistance. Market breadth indicators show low breadth and very low volatility regimes, with fear in the broader market signals noted by data sources. BTC/ETH flows show negative short-term momentum in BTC, which provides a macro backdrop for risk assets, including ADA.
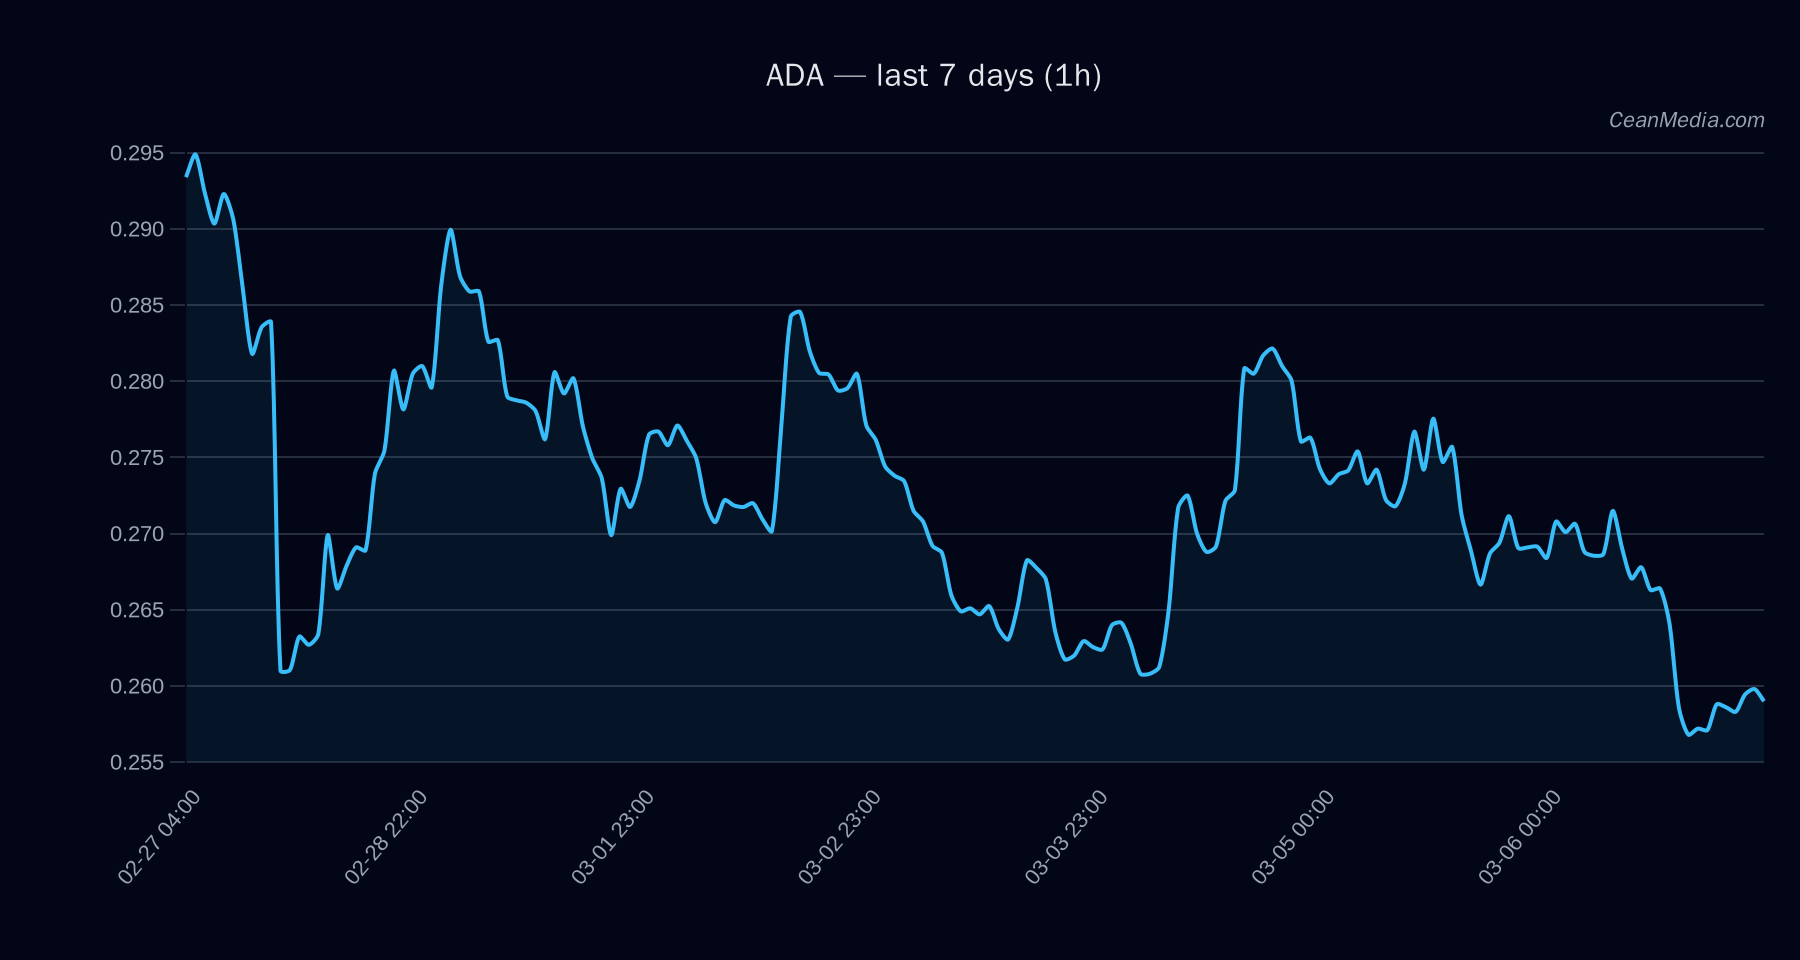
Technical Analysis: ADA
- Price & Range: 0.2595; Band (P20–P80): 0.2475 – 0.2719.
- Key Levels: Major/near support at 0.26 and 0.255; Major/near resistance at 0.285 and 0.265.
- Bias: Short-term forecast indicates a down bias (55%), with probabilities: Up 39%, Side 6%, Down 55%.
- Momentum Indicators: EMA12 < EMA26; SMA50 < SMA200; RSI 37 (neutral to oversold territory).
- Volatility & Regime: σ24h = 0.65%; Vol regime: Very low.
- On-Price Triggers: Upside: a 1h close > 0.265 targets 0.27–0.2753; Downside: 1h close < 0.255 targets 0.2492–0.2441.
- Distance from MA: distance_from_ma = -0.034 (below moving averages).
- Contextual Signals: F&G Fear/Greed index shows Extreme Fear; BTC dominance around mid-50s; BTC/USD 24h return negative, reinforcing risk-off sentiment.
Drivers
- Top 5 contributors to current view: Return 24h (-0.04), EMA slope (-0.001), Funding z-score (-1.45), Basis z-score (-0.68), Order-book imbalance EMA5 (-0.0029).
- BTC-related momentum: BTC 24h return (-0.04); BTC volatility regime negative, trend strength positive but limited.
- Other metrics: RV 7d modest positive; vol-of-vol and distance-from-MA suggest a cautious stance.
ETF Flows (BTC/ETH)
Context: ETF flow data provided pertains only to BTC and ETH ETFs. The reported numbers show a net negative 1D flow for BTC (-$139.2M) and positive cumulative signals across the 5D and 10D windows (+$86.4M and +$597.5M, respectively). ETH 1D flow is negative (-$122.0M) with mixed 5D and 10D signals (+$0? to +$89.4M). These figures reflect risk-on/off dynamics in the broader crypto market, but are not primary signals for ADA. They should be interpreted as macro liquidity context that can influence correlation and risk appetite for altcoins like ADA.
What to Watch Next
- Watch for a close above 0.265 to validate a potential move toward 0.27–0.2753 in the near term.
- Declines below 0.255 would open 0.2492–0.2441 support zone; monitor for any accelerated downside triggers.
- Monitor BTC ETF flow momentum for shifts in risk sentiment that could spill over into altcoins like ADA.
- Keep an eye on RSI movement away from current 37; a sustained move below 35 would reinforce bearish bias, while a climb may reduce downside pressure.
Hashtags: #ADA #Cardano #CryptoAnalysis #TechnicalAnalysis #ETFFlows #BTC #ETH #Altcoins #MarketSnapshot