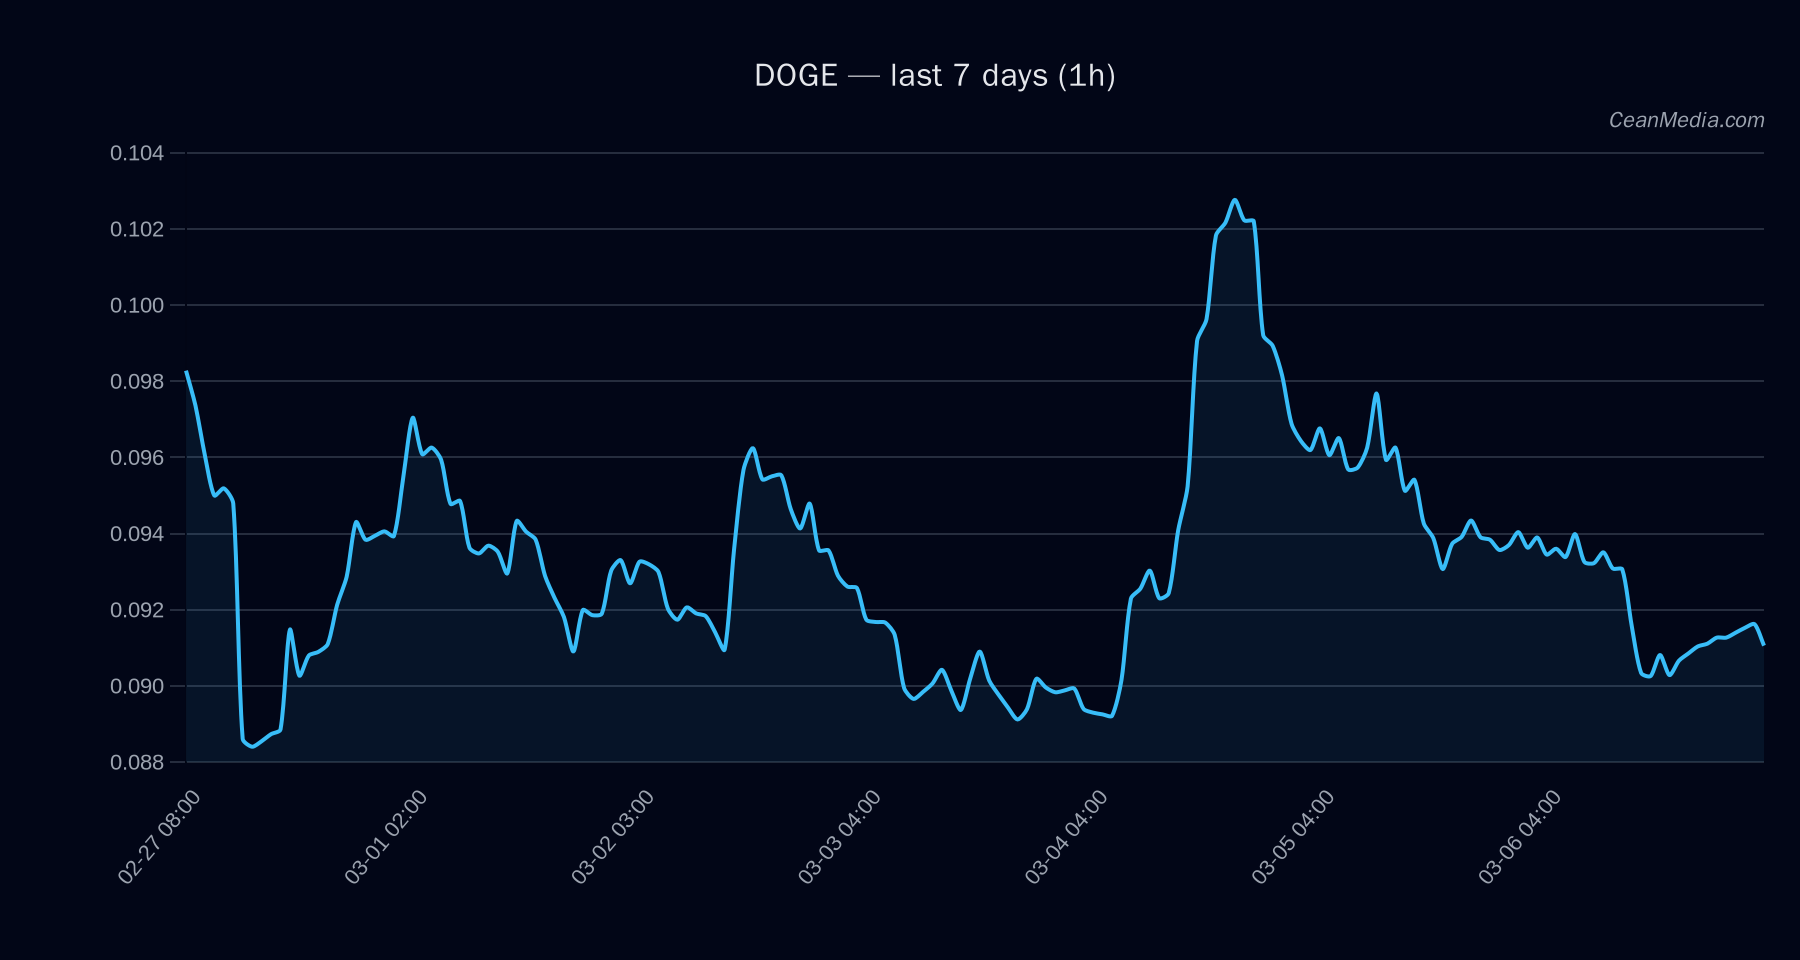
Price: 0.0907. Short-Term Forecast: down (54%). Key levels: Support 0.091 (major), 0.089 (near); Resistance 0.099 (major), 0.093 (near). The immediate range (P20–P80) is 0.0875–0.094 with a bias toward downside under the current balance of momentum indicators. The asset exhibits very low volatility regime, with RSI at 37, and EMA/MA alignments indicating bearish pressure (EMA12
Technical Analysis: DOGE
Bearish near-term bias given EMA and moving average alignments and RSI below 40. Forecast indicates a 54% probability of downside movement over the next ~24 hours.
Distance from MA: -0.0229; Drawdown 30d: -28.4%; Breakout 7d: -0.11; Spread metrics indicate modest compression with limited directional impulse.
ETF Flows (BTC/ETH)
The ETF flows data presented here covers BTC and ETH only and should be interpreted as contextual market activity rather than a primary signal for DOGE. As of the latest reading, BTC ETFs show -$205.4M in 1D, -$91.5M in 5D, and +$304.0M in 10D. ETH ETFs show -$86.7M in 1D, -$82.5M in 5D, and -$0.3M in 10D. The overall flow pattern suggests a cautious/ risk-off tilt in the broader market on intraday horizons, but it is not a direct driver for DOGE price action.