Market Snapshot
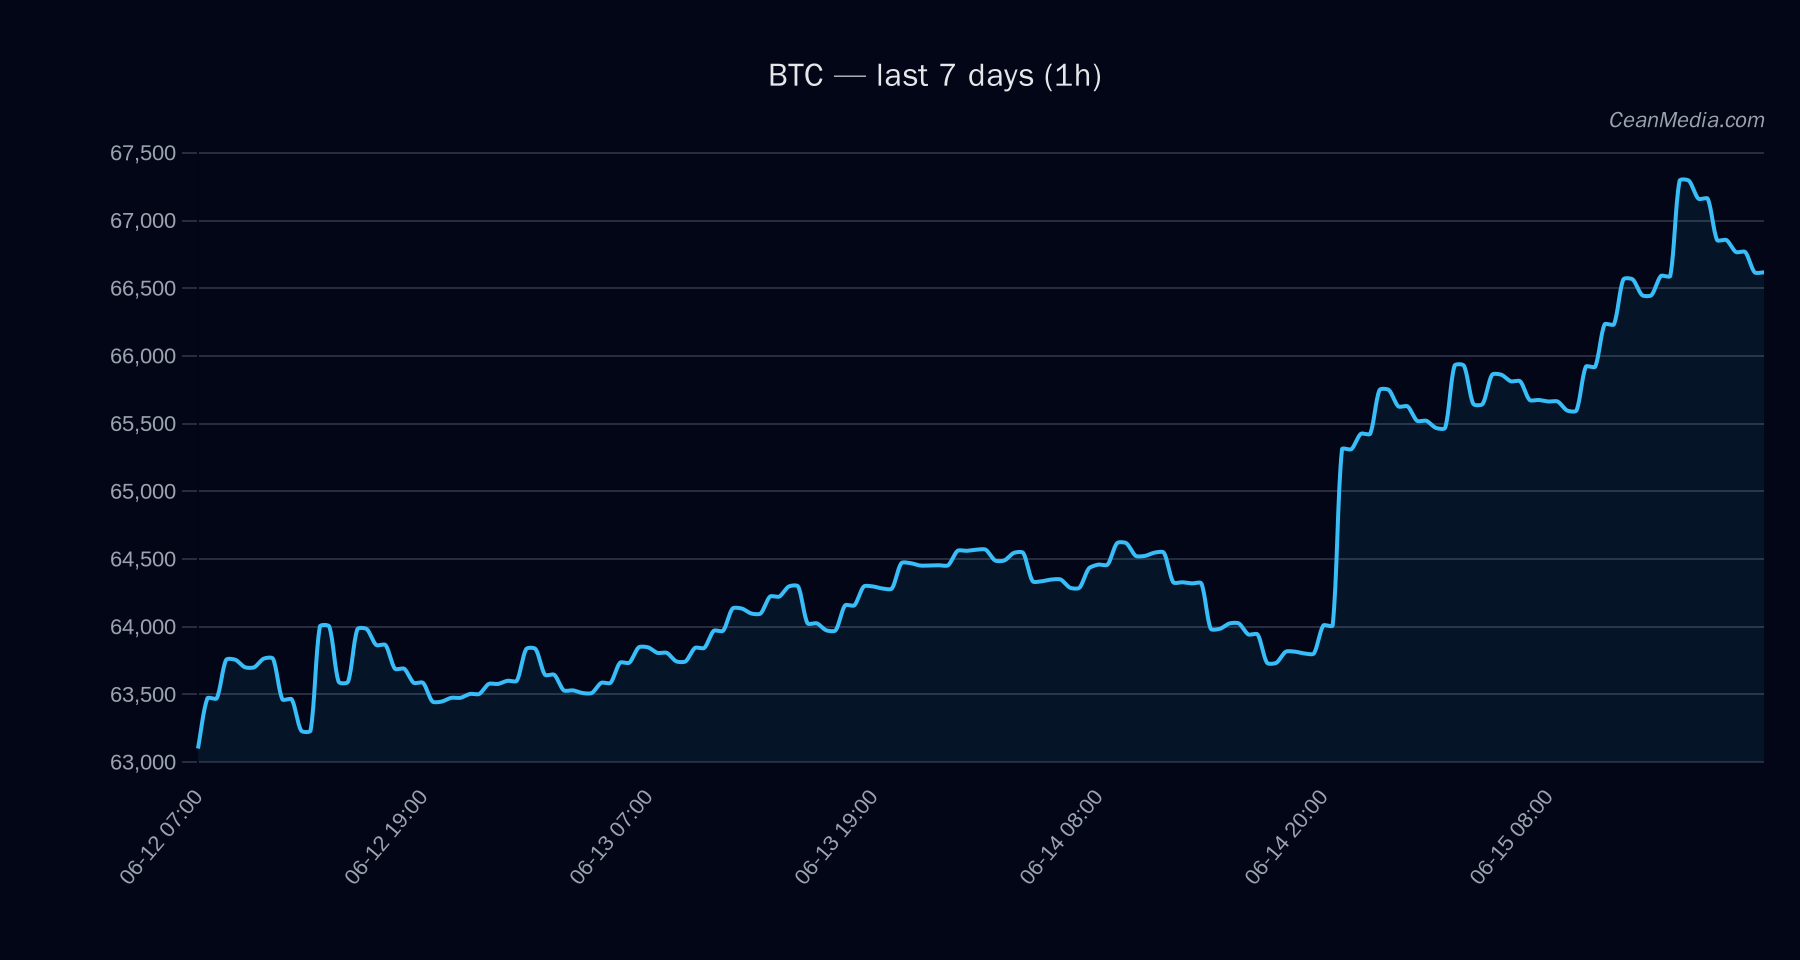
Bitcoin (BTC) trades in a narrow range around the mid-66k area, with a bullish technical tilt supported by a series of trend indicators and a relatively low volatility regime. The model signals a sideways forecast with a slight bullish skew, while data completeness sits around 87% and the snapshot age is roughly 0.5 hours.
Technical Analysis: BTC
: +3.1 | conflicts 0 : EMA12 > EMA26, SMA50 > SMA200, RSI 62, σ24h 0.54%, Vol regime: Very low - Support: near 65,250 | major 63,400
- Resistance: near 67,925 | major 69,775
- Up: 1h close > 67,925 → 69,275.15 / 70,633.48
- Down: 1h close < 65,250 → 63,948.34 / 62,643.27
- P50: 66,490.85
- P20-P80: 65,371.56 – 68,470.56
Drivers
: - RET_24H: +0.04%
- EMA SLOPE: +0.0003
- FUNDING Z-SCORE: -1.514
- BASIS Z-SCORE: -0.339
- OBI EMA5: +0.144
- BTC RETURN 24H: +0.04%
: - Vol regime: Very low
- BTC.D: 56.4% (+0.3%/7d)
- Breadth: 100% above SMA50
- Correlation (BTC, 72h): 1.00
- F&G: 20 (Extreme Fear)
ETF Flows (BTC/ETH)
Context on ETF flows is provided for market framing; data shown covers BTC and ETH ETFs only and should not be treated as a primary signal for BTC direction. The BTC ETF data indicates a one-day inflow while 5-day and 10-day figures are negative, implying varied near-term positioning. ETH ETF data shows net outflows in the same windows. Investors should consider ETF flows as part of broader market context rather than standalone indicators for BTC moves.
: 1D +$85.9M | 5D -$319.3M | 10D -$120.9M : 1D -$4.9M | 5D -$14.8M | 10D -$35.6M
What to Watch Next
- Watch for a close above 67,925 to validate bullish continuation toward 69,275–70,633.
- A break below 65,250 would shift focus toward 63,948–62,643 in a potential downside extension.
- Monitor volatility regime as it remains very low; any abrupt pickup could alter risk parameters despite the current trend indicators.
- Keep an eye on ETF flow shifts in BTC/ETH as a contextual risk-on/off signal, though not a primary BTC signal.
Hashtags: #BTC #Bitcoin #MarketAnalysis #TechnicalAnalysis #ETFFlows #CryptoMarkets #CryptoTrends #PriceLevels #SupportResistance #MarketContext #Volatility #Liquidity