Market Snapshot
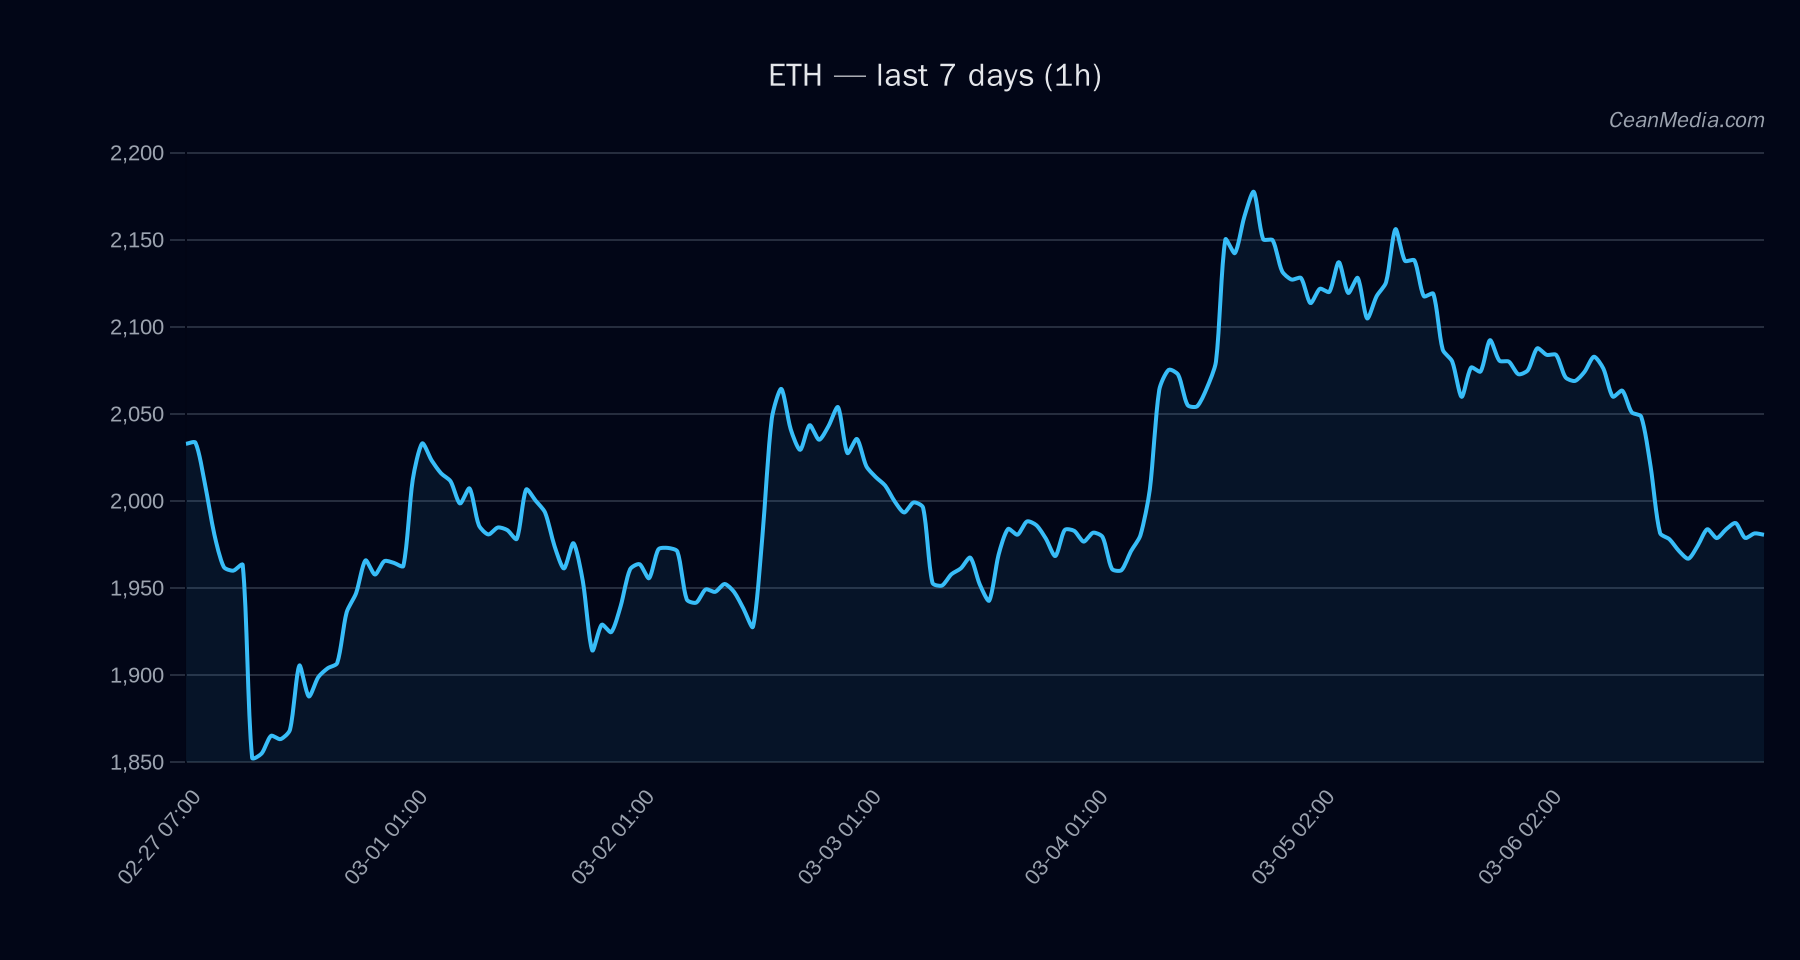
ETH trades near key support and resistance, with a currently observed price of 1,978.36. The near-term bias is described as up with a 48% probability, while the remaining distribution shows roughly equal chances of upside and downside moves. The market context includes a very low volatility regime and a neutral RSI around 32, indicating the asset is not overbought and is closer to oversold territory.
Technical Analysis: ETH
- 1,978.36
- Short-Term Forecast: Up (48% probability) with sideways TA notes (EMA12
- Key bands: P20–P80 range 1,925.10 – 2,079.58; P50 (mid) 2,004.55
- Support / Resistance: Major Support 1,868; Near Support 1,938; Major Resistance 2,076; Near Resistance 2,018
- Upside scenario: 1h close > 2,018 → potential move to 2,058.29 – 2,098.64
- Downside scenario: 1h close < 1,938 → potential move to 1,900.02 – 1,861.24
Bias and triggers: The bias is described as sideways with a tilt toward upside given the close above near support. A break above 2,018 would be a bullish trigger targeting the 2,058–2,099 zone. A break below 1,938 would be bearish, targeting the 1,900–1,861 zone. The moving average configuration (EMA12
Drivers
- Return 24H: -0.05%
- EMA Slope: -0.001
- Funding Z-Score: -0.66
- Basis Z-Score: -1.13
- Order-Book Imbalance (EMA5): -0.23
- BTC Return 24H: -0.04%
- BTC Vol Regime: -1
- BTC Trend Strength: 1.76
The set of drivers indicates modest negative momentum across spot BTC and ETH metrics, with momentum and volatility signals currently subdued (Very Low Vol regime). Correlations with BTC remain positive, underscoring overall market linkedness but without strong directional persistence in the ETH-specific data at this time.
ETF Flows (BTC/ETH)
ETF flow context is provided for BTC and ETH only, and should be viewed as a broader market signal rather than a primary driver for ETH pricing. Current data show:
- BTC ETF: -$139.2M (1D), +$86.4M (5D), +$597.5M (10D)
- ETH ETF: -$122.0M (1D), -$37.5M (5D), +$89.4M (10D)
Interpretation: The ETF flows suggest risk-off pressure in BTC on the latest day, with modest longer-term inflows in BTC across 5–10 days. ETH ETF data show a recent outflow on the 1D horizon with modest longer-term inflows over 10D. This ETF context is not a primary signal for ETH pricing but provides qualitative background on market risk sentiment and potential liquidity dynamics affecting cross-asset correlations.
What to Watch Next
- Monitor for a daily close above 2,018 to validate upside targeting 2,058–2,098.
- Watch for a daily close below 1,938 to anticipate a drop toward 1,900–1,861.
- Assess changes in volatility regime; a shift from Very Low to higher regimes could precede larger price moves.
- Keep an eye on BTC-related signals, given the observed positive correlation, for potential spillover effects on ETH pricing.
Hashtags: #ETH #Ethereum #CryptoMarkets #TechnicalAnalysis #ETFFlows #Bitcoin #BTC #MarketSnapshot #Momentum #Volatility #Fundamentals #TradingStrategy