Market Snapshot
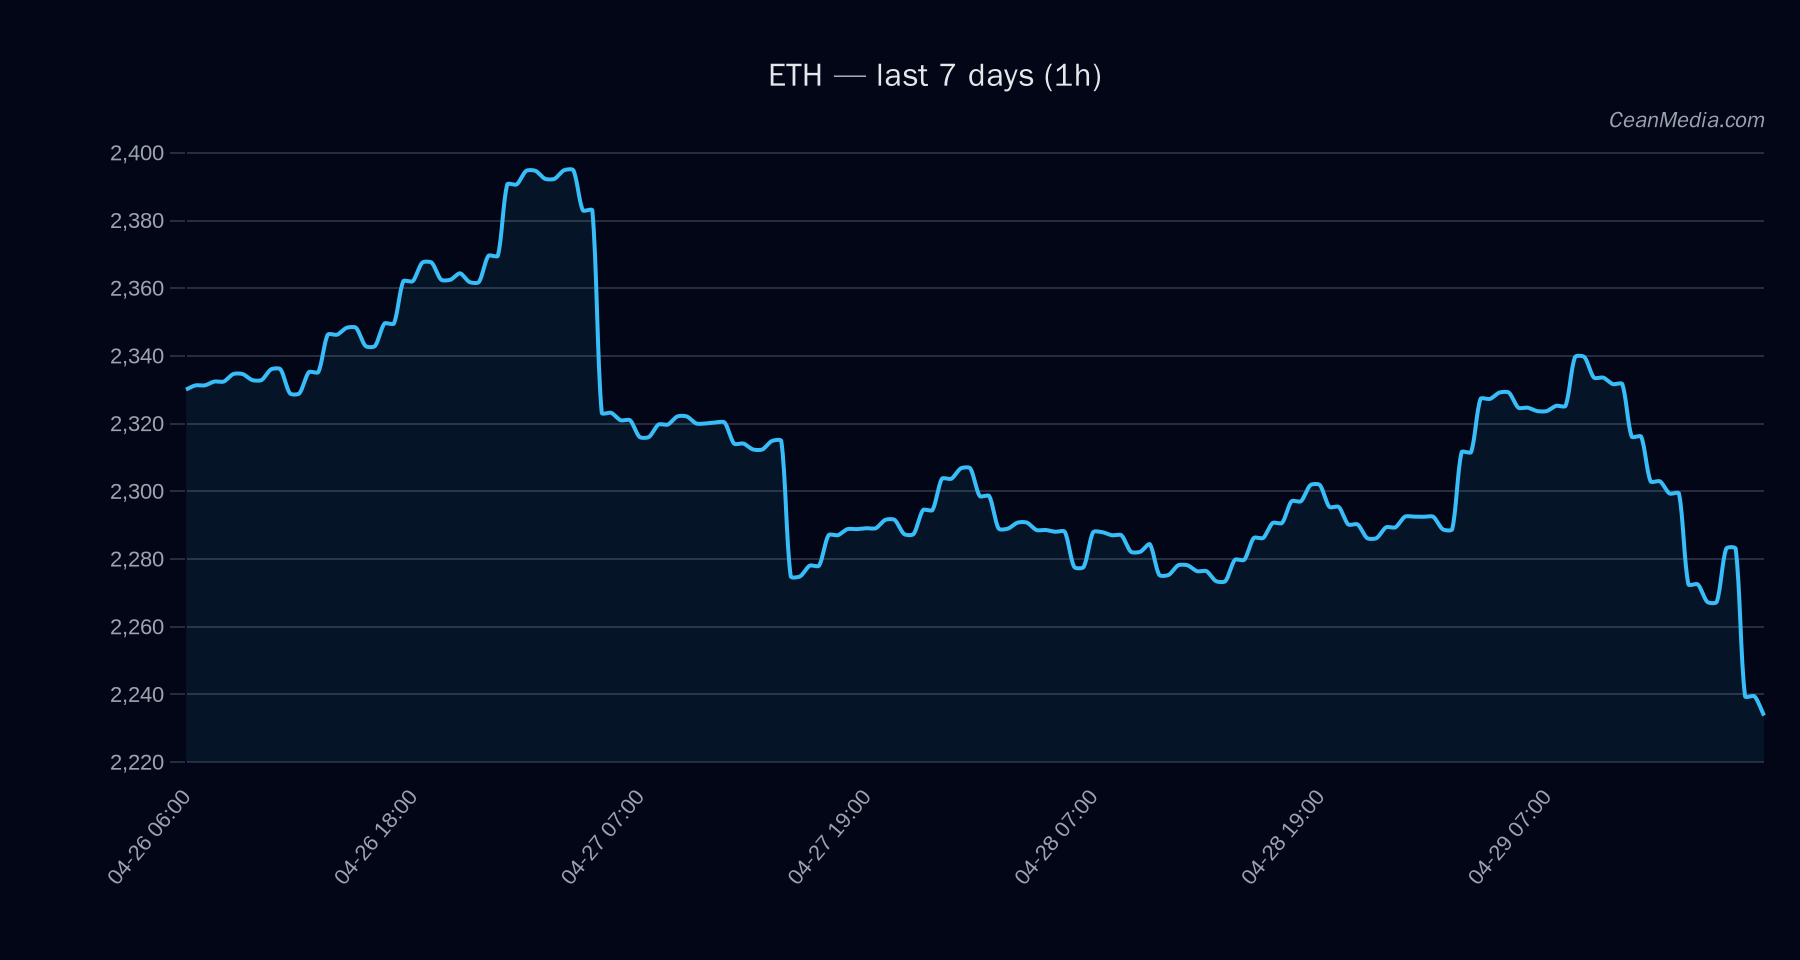
ETH remains range-bound between near-term support and resistance as markets digest a mix of technical signals and external ETF flow context. The latest structure places the current price around the 2,239 level, with a short-term forecast skewed toward upside conditioned by a bullish bias given the position within the defined band.
Technical Analysis: ETH
- Current level: 2,239
- Trading band: 2,200.96 – 2,313.12 (P20–P80)
- Key levels: Support Major 2,282; Near 2,194; Resistance Major 2,388; Near 2,284
- Forecast and bias: Up (75% probability) with TA labeled bearish indicators (EMA12
- Projected triggers: Break above 2,284 targets 2,329.46 to 2,375.13. Break below 2,194 targets 2,150.34 to 2,106.45.
- Volatility and regime: Very low volatility regime; σ24h approximately 0.58%.
- Key drivers snapshot: Mixed signals with notable contributions from liquidity-to-open interest (positive) and order-book imbalance (negative). Overall, breadth indicators are muted (Breadth >50h: 0%).
- Invalidation point: Break below near-term support of 2,194 undermines the 2,282–2,284 zone and shifts focus toward the lower band targets (2,150–2,106).
Drivers
- Top contributors: LS Top Z-Score (positive), Funding Z-Score (positive), Basis Z-Score (positive).
- Lagging/secondary signals: EMA slope negative, overall trend strength currently modest but positive on horizon, distance from MA slightly negative indicating slight pullback potential vs. moving averages.
- Momentum reads: Trend strength around 1.01; BTC dominance at ~58.1% with a slight daily dip; BTC 72h correlation remains high at ~0.92, suggesting ETH moves are still tied to BTC-driven risk sentiment.
- Volume/volatility: Very low vol regime, vol-of-vol near minimal; liquidity-to-Open Interest shows mixed pressure (positive LIQ TO OI Z-Score, negative EMA5 balance).
ETF Flows (BTC/ETH)
Context: ETF flow data provided is limited to BTC and ETH as benchmarks for market risk sentiment. This information should be interpreted as supplementary context rather than a primary signal for ETH-specific trading decisions.
- BTC ETF: 1D -$89.7M, 5D -$199.0M, 10D +$572.3M
- ETH ETF: 1D -$21.8M, 5D -$80.6M, 10D +$201.3M
Interpretation: The net ETF flow data suggests a net outflow from BTC on the 1D horizon with continued but smaller outflows from ETH on similar timescales. Over 10 days, ETF flows show a larger positive bias for BTC again, which can reflect shifting risk-on/off dynamics in macro frames. It is important to reiterate that ETF data is a context driver and not a primary ETH signal. Market participants should weight this alongside price structure and on-chain signals.
What to Watch Next
- Watch for a close above 2,284 to validate upside continuation toward 2,329–2,375 in the near term.
- Monitor any break below 2,194, which would shift the focus toward lower targets around 2,150–2,106.
- Keep an eye on BTC dominance moves and BTC price action, given the high 72h correlation and their influence on ETH risk sentiment.
- Note the ongoing low volatility regime; any volatility spike could re-map the immediate support/resistance dynamics quickly.
Hashtags: #ETH #Ethereum #CryptoMarkets #TechnicalAnalysis #ETFFlows #BTC #PriceAction #TradingStrategy #MarketSnapshot #RiskManagement #Liquidity
Note: The ETF data presented here is BTC/ETH focused and should be treated as contextual information rather than a primary signal for ETH trading decisions.