Market Snapshot
Cardano (ADA) is trading near key support at 0.25 with near-term resistance at 0.26. The immediate band of interest spans 0.2447–0.2729 (P20–P80). The short-term forecast leans bearish with a 57% probability of downside. Key levels include major support at 0.26 (near 0.25) and major resistance at 0.28 (near 0.26). Breadth indicators show breadth <50h at 0%, suggesting weak broader market participation. Overall volatility is described as very low, with RSI near oversold at 35. Fundamental momentum signals are modestly negative based on recent price action and indicator readings.
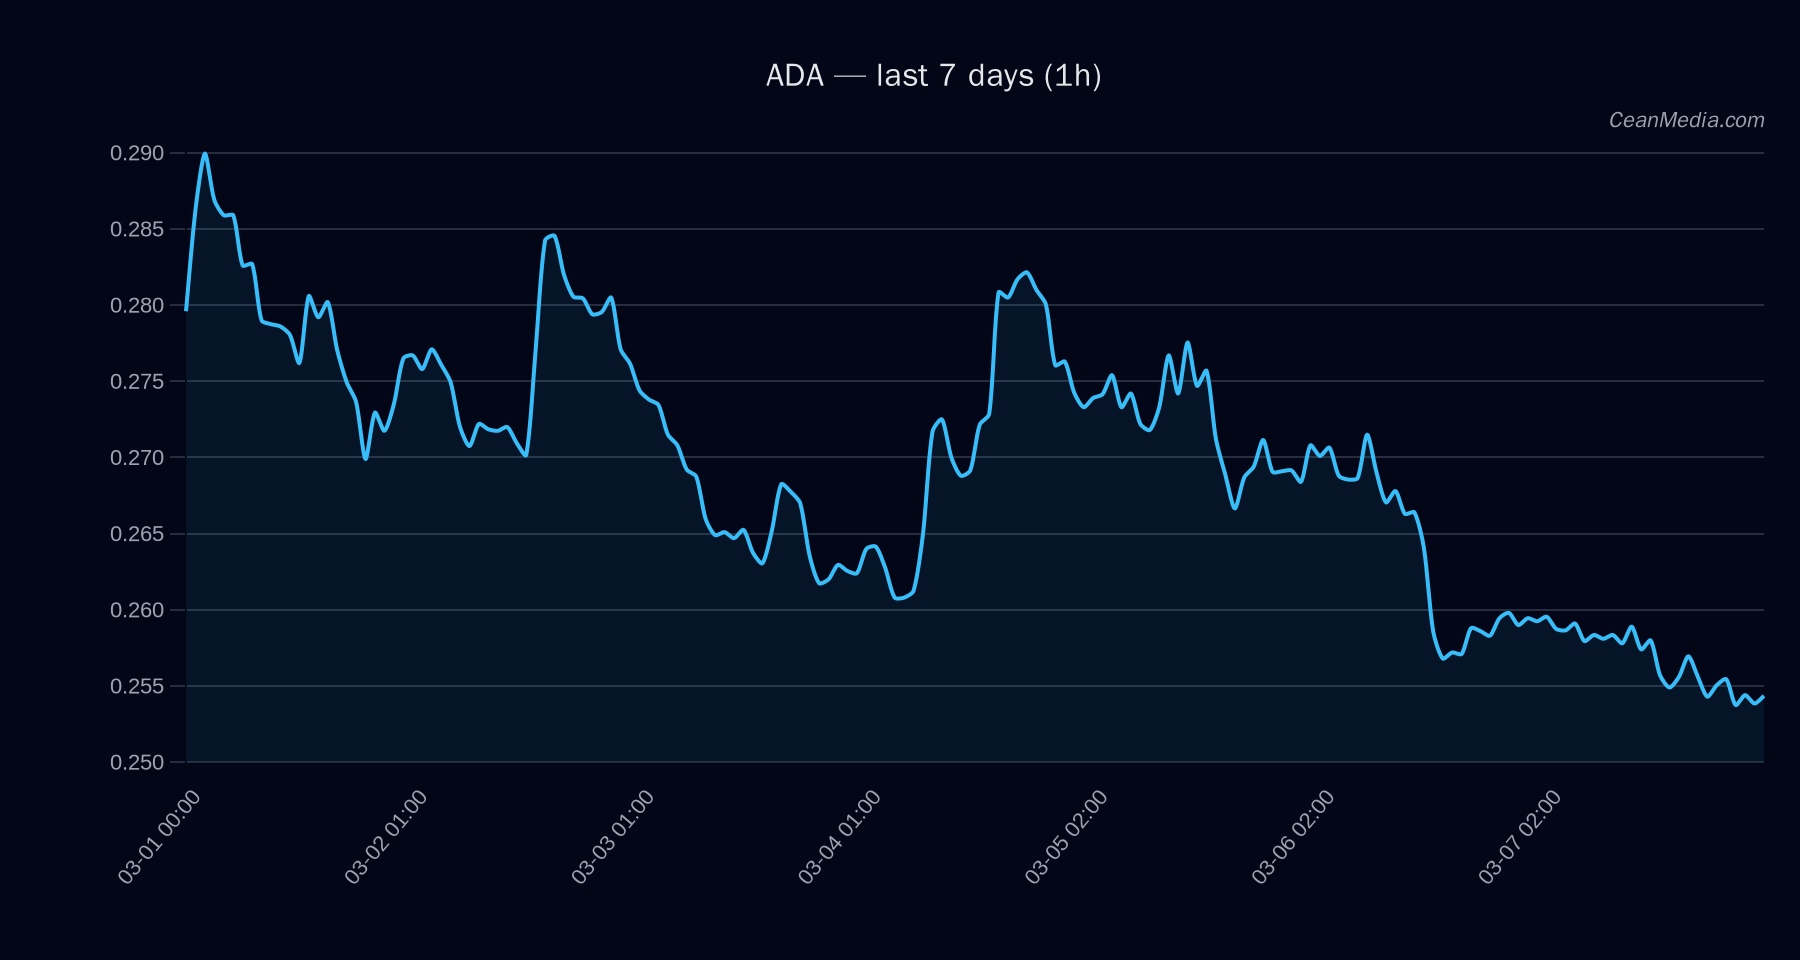
Technical Analysis: ADA
- Current Price: 0.2534
- Bias: Down (bearish)
- Key Indicators: EMA12 < EMA26; SMA50 < SMA200; RSI 35; 24h volatility 0.37%; Volatility regime: Very low
- Forecast: 57% probability of downside over the next 24 hours
- Support / Resistance: Major support 0.26; Near support 0.25; Major resistance 0.28; Near resistance 0.26
- Upside Trigger: 1h close above 0.26 could target 0.2636–0.2688
- Downside Trigger: 1h close below 0.25 could target 0.2434–0.2384
- Invalidation/Range: If price breaks outside the defined band on a sustained basis, re-evaluate with updated inputs.
Drivers
- Return 24h: -0.02
- EMA slope: -0.0006
- Funding Z-score: -0.79
- Basis Z-score: -0.92
- Order-book Imbalance (EMA5): -0.04
- BTC Return 24h: -0.01
- BTC Vol Regime: -1
- BTC Trend Strength: 1.1
ETF Flows (BTC/ETH)
Note: ETF flow data presented here pertains only to BTC and ETH and serves as contextual market sentiment rather than a direct signal for ADA. Current observed flows show BTC and ETH ETFs experiencing mixed to negative momentum on a 1D to 10D horizon.
- BTC ETF: 1D -$205.4M | 5D -$91.5M | 10D +$304.0M
- ETH ETF: 1D -$86.7M | 5D -$82.5M | 10D -$0.3M
What to Watch Next
- Potential breakout above 0.26 could shift the near-term bias toward a test of 0.2636–0.2688.
- A sustained close below 0.25 would open a path toward 0.2434–0.2384.
- Monitor ETF flow signals as contextual risk-on/off momentum for broader crypto markets, not as a direct ADA signal.
- Keep an eye on RSI movement toward the oversold/neutral region and any change in volatility regime from very low to higher levels.
Hashtags: #ADA #CryptoMarket #TechnicalAnalysis #TradingStrategy #ETFFlows #BTC #ETH #MarketSnapshot #PriceAction #Indiators