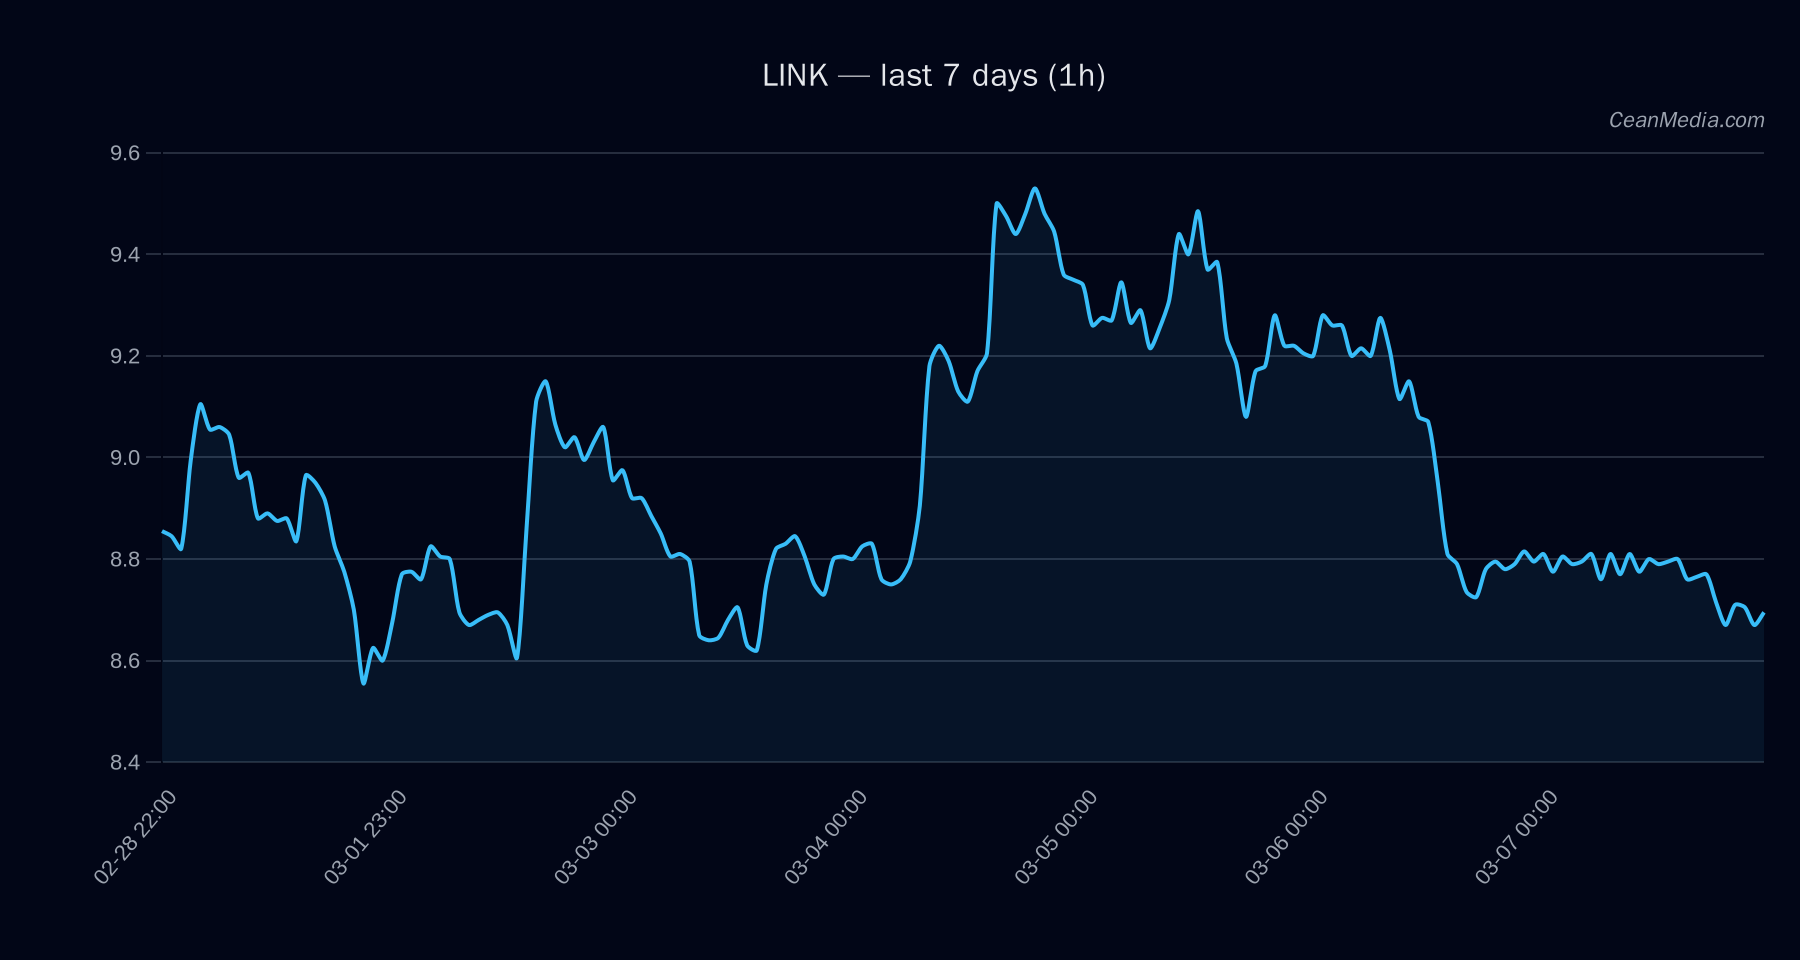
Market Snapshot
Current price (LINK): 8.70. The near-term bias remains bearish with a 57% probability of downside over a 24-hour horizon, and a 37% probability of upside. The instrument is trading within a defined range: 8.32 (major support) to 9.26 (major resistance), with a near-term band of 8.52–8.88. Market breadth is weak (Breadth>50h: 0%), and overall volatility is described as Very Low, with RSI at 39 indicating oversold pressure but not extreme.
Technical Analysis: LINK
Support 8.52 (near) / 8.32 (major); Resistance 8.88 (near) / 9.26 (major). If price breaks above 8.88, target ranges extend toward 9.0515–9.229. If price breaks below 8.52, target ranges extend toward 8.3555–8.185. EMA12 < EMA26, SMA50 < SMA200; RSI 39 (neutral to bearish); Vol regime: Very Low; σ24h: 0.35%. Down 56.8%, Up 36.6%, Sideways 6.5% (P50: 8.6699).
Drivers
Return 24h: -0.01; EMA slope: -0.0007; Funding Z-score: -1.62; Basis Z-score: -1.56; Order-book Imbalance (EMA5): 0.07; BTC Return 24h: -0.01; BTC Vol Regime: -1; BTC Trend Strength: 0.956. Volatility regime is Very Low; F&G (Fear & Greed index) at 12 (Extreme Fear). BTC.D at 56.5% (+0.2%/7d).
ETF Flows (BTC/ETH)
ETF flow context is provided for BTC and ETH as a market sentiment backdrop. The data shown is BTC/ETH-focused and should be interpreted as context rather than a direct signal for LINK. 1D BTC ETF flows: -$205.4M; 5D: -$91.5M; 10D: +$304.0M. 1D ETH ETF flows: -$86.7M; 5D: -$82.5M; 10D: -$0.3M. These figures suggest a mixed to cautious risk-on/off backdrop, with notable short-term outflows in BTC and modest/mixed activity in ETH over 1–5 days, while the 10-day picture shows a net positive in BTC and small ETH movement.
What to Watch Next
- Watch for a break above 8.88 to confirm a potential move toward 9.05–9.23.
- Monitor for a break below 8.52 to confirm a decline toward 8.36–8.19.
- Keep an eye on BTC ETF flow signals as supplementary context but treat as non-primary signal for LINK.
- RSI remains in the lower 30s–40s; observe any acceleration in volatility or breadth to gauge momentum shifts.
Hashtags: #crypto #linksociety # LINKanalysis #marketview #tradinganalysis #ETFFlows #BTCflows #RSI #EMA #SMA #orderbook #volatility