Market Snapshot
On 2026-03-15, DOGE is trading around 0.097, with near-term support at 0.095 and resistance at 0.099. The price is within a tight range between the major levels, implying a balanced to mildly bearish short-term bias unless a breakout occurs. The broader context shows a very low volatility regime and a mixed momentum backdrop, with RSI at 63 and an EMA/MA alignment currently bullish (EMA12>EMA26 and SMA50>SMA200).
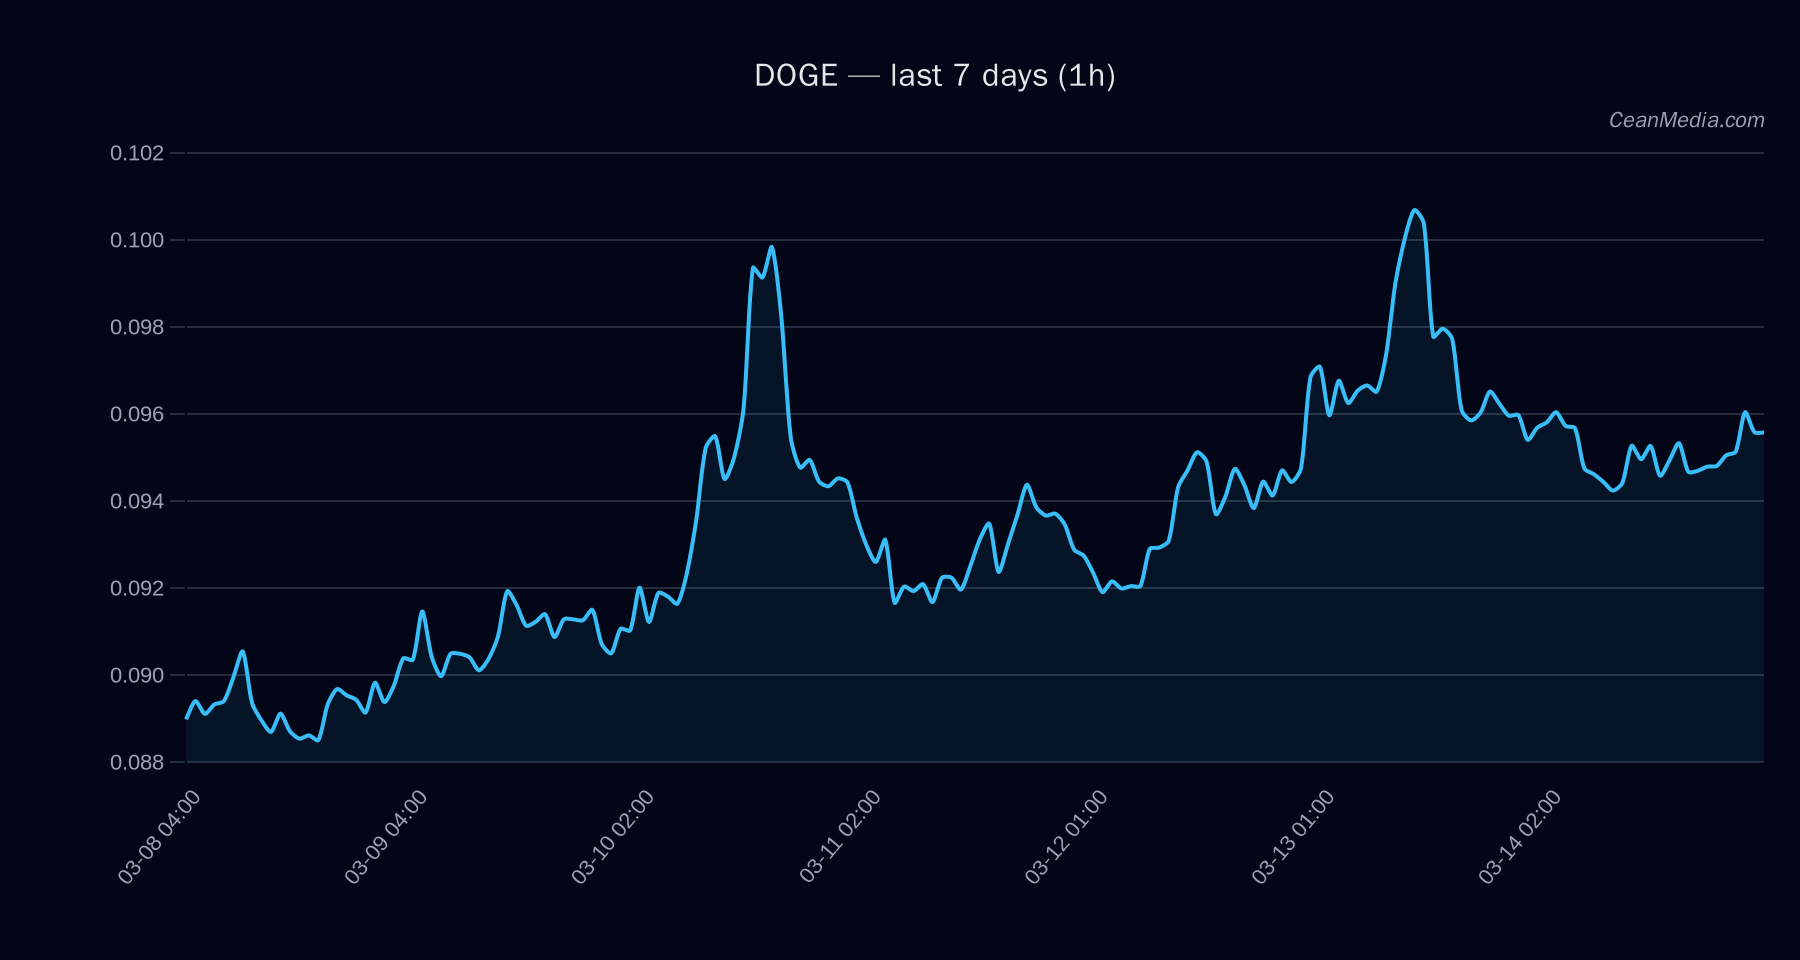
Technical Analysis: DOGE
Major support at 0.09 with near-term support at 0.095; major resistance at 0.099 with near-term resistance also at 0.099. Break above 0.099 could open to 0.1009–0.1029; break below 0.095 could drop to 0.0931–0.0912. EMA12 is above EMA26; SMA50 is above SMA200, indicating longer-term bullish alignment. RSI at 63 suggests neutral to mildly bullish momentum within the range. σ24h at 0.54% and a very low volatility regime. This supports consolidation with a higher sensitivity to a breakout or breakdown rather than sustained directional moves. Direction: DOWN with probability ~0.529; Up probability ~0.427; sideways ~0.044. The P50 price is ~0.09475; the P20–P80 band spans 0.0927–0.0989. Break above 0.099 (invalidates the downside focus) and targets 0.1009–0.1029; break below 0.095 (invalidates the upside view) targets 0.0931–0.0912.
Drivers
24h return -0.0011; EMA slope +0.0006; Funding Z-Score -0.2; Basis Z-Score -0.57; Order-book imbalance (EMA5) +0.025–0.03 range; BTC 24h return +0.0023; BTC volatility regime -1; BTC trend strength ~0.19. Breadth >50h at 67%; BTC.D at 56.9% (+0.4%/7d); alt-breadth ex-mega at 50%; volatility regime very low; Fear Index (F&G) at 15 (Extreme Fear) indicating cautious risk sentiment.
ETF Flows (BTC/ETH)
Contextual ETF flow data is provided for BTC and ETH and is not a primary signal for DOGE. The BTC ETF shows +$36.8M in 1D flows (+$0.3M 5D; +$86.7M 10D), while ETH ETF flows are negative in the observed windows (-$0.3M 1D; -$21.3M 5D; -$58.8M 10D). This suggests a cautious risk-on/off environment reflected in BTC/ETH diversification but should not be taken as a direct DOGE signal. Traders should consider ETF activity as a context indicator for broader market liquidity and risk appetite.
What to Watch Next
- Watch for a close above 0.099 to confirm upside continuation toward 0.1009–0.1029.
- Monitor a break below 0.095 to assess potential move toward 0.0931–0.0912.
- Observe BTC ETF flow momentum and BTC/ETH volatility shifts as a contextual risk indicator, not a DOGE trigger.
- Keep an eye on changes in EMAs and RSI momentum that could precede a breakout or breakdown in DOGE.
Hashtags: #CryptoMarket #DOGEAnalysis #TechnicalAnalysis #ETFFlows #BTC #ETH #RiskOn #Liquidity #Altcoins #CryptoTrading #MarketSentiment