Market Snapshot
Ethereum (ETH) traded around the 2,084 level with a near-term bias aligned to a drift lower, as indicated by the short-term forecast of down (49%) and a 43% probability of upside against a 49% downside. The current price sits between a defined support at 1,984 (major) and a near-term resistance at 2,042 (near) with a critical Major Resistance at 2,102 and a near resistance at 2,126. The volatility regime is described as very low with a 24-hour volatility of approximately 0.33% and RSI around 50, indicating a balanced momentum state.
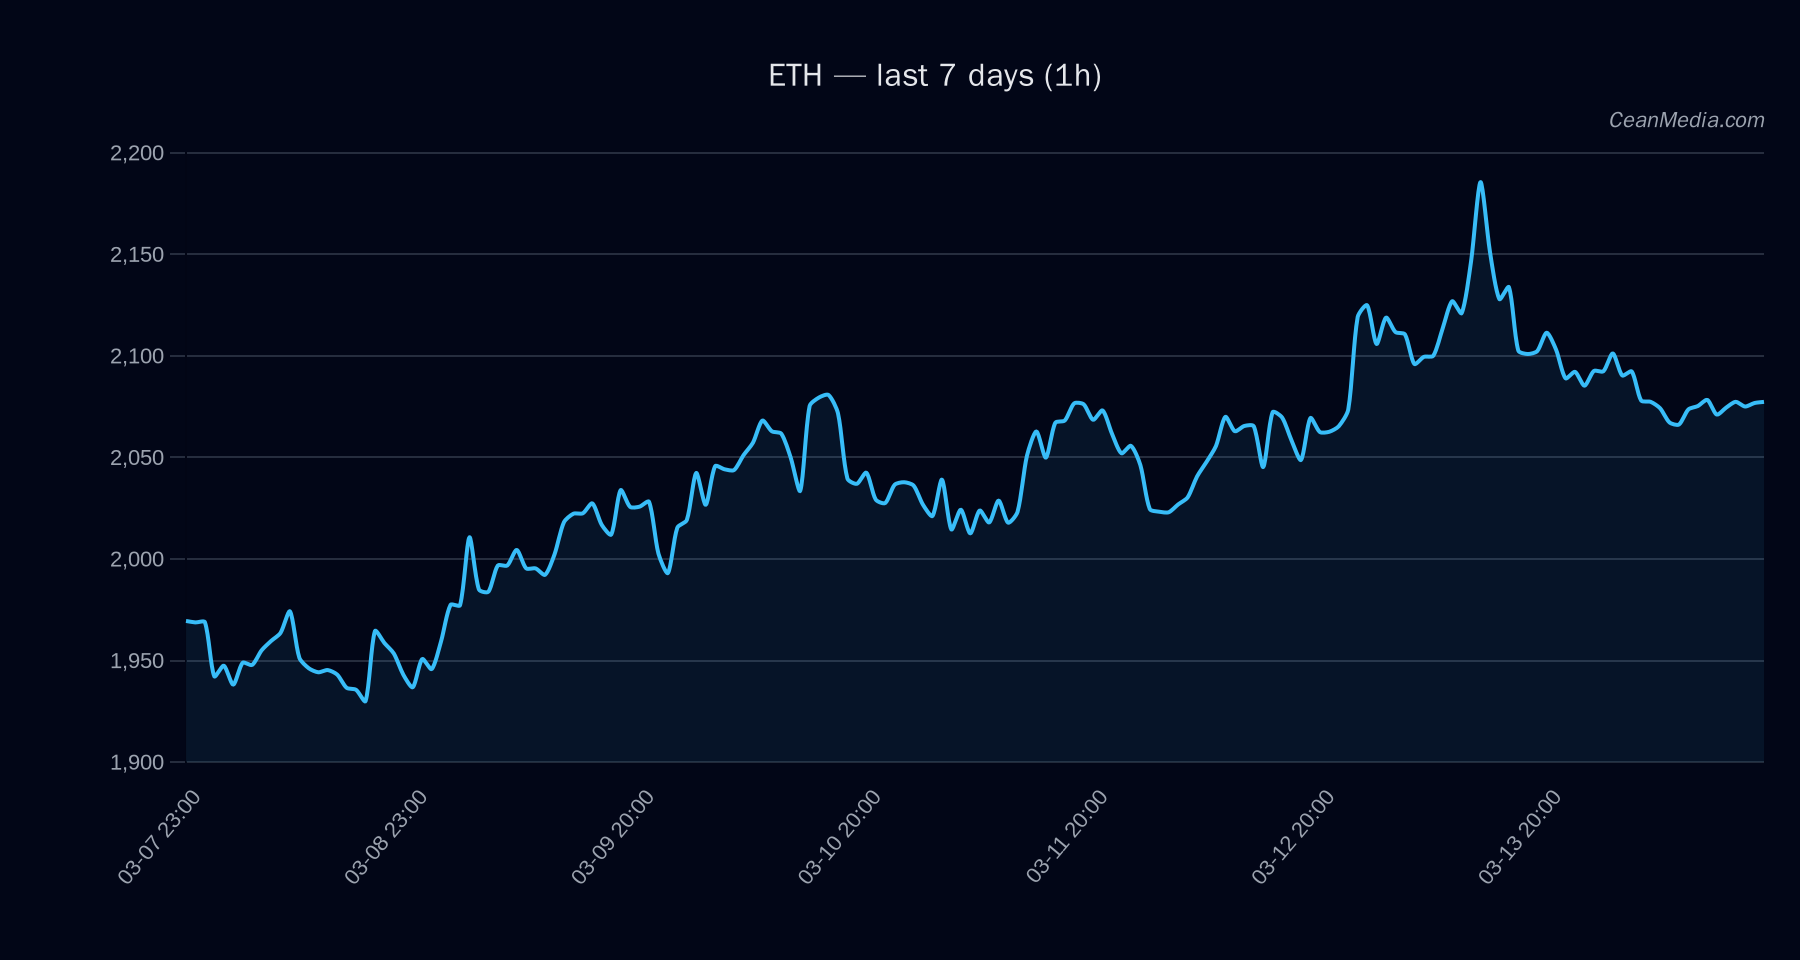
Technical Analysis: ETH
- Current price: 2,084.1
- Bias & forecast: Down (49%), sideways overall with mixed signals (EMA12
- Key levels:
- Support (Major): 1,984
- Support (Near): 2,042
- Resistance (Near): 2,126
- Resistance (Major): 2,102
- Trade bands: P20–P80: 1,992.30 — 2,128.81; P50: 2,093.88
- Triggers:
- Break above 2,126 → potential move toward 2,168.30 to 2,210.81
- Break below 2,042 → potential move toward 2,001.57 to 1,960.72
- Top drivers (selected):
- Return 24H: -0.01
- EMA Slope: flat
- Funding Z-Score: -0.72
- Basis Z-Score: -0.87
- Order-book Imbalance (EMA5): -0.15
- BTC Return 24H: -0.0068
- BTC Vol Regime: -1
- BTC Trend Strength: 0.58
- Context: Breadth>50h at 0%, BTC/eth breadth metrics and volatility regime suggest cautious positioning; F&G index indicates Extreme Fear (16). BTC.D at 56.9% with a +0.4% move over 7d. ETF flows show net outflows domestic to ETH in the short window, though BTC ETFs display inflows.
Drivers
- Return 24H: small negative
- EMA Slope: flat
- Funding Z-Score: -0.72
- Basis Z-Score: -0.87
- Order-book Imbalance (EMA5): -0.15
- BTC Return 24H: -0.0068
- BTC Vol Regime: -1
- BTC Trend Strength: 0.58
ETF Flows (BTC/ETH)
Context note: ETF flow data shown here pertains to BTC and ETH ETFs only and serves as market context rather than a primary signal for ETH pricing. The data indicates:
- BTC ETF: +$36.8M (1D), +$0.3M (5D), +$86.7M (10D)
- ETH ETF: -$0.3M (1D), -$21.3M (5D), -$58.8M (10D)
What to Watch Next
- Monitor a sustained break above 2,126 for potential intraday extension toward 2,168–2,210.
- Watch for a break below 2,042 to anticipate a move toward the 2,002–1,961 range.
- Observe ETF flow momentum alongside BTC performance; use BTC ETF inflows/outflows as a context for risk-on/risk-off shifts, not a direct ETH signal.
- Keep an eye on overall market breadth and volatility regime signals for potential regime shifts.
Hashtags: #ETHMarket #ETHTechnicals #CryptoAnalysis #ETFFlows #BTCETHContext #MarketBias #TradingLevels #SupportResistance #CryptoVolatility #MomentumTrading #MarketOutlook