Market Snapshot
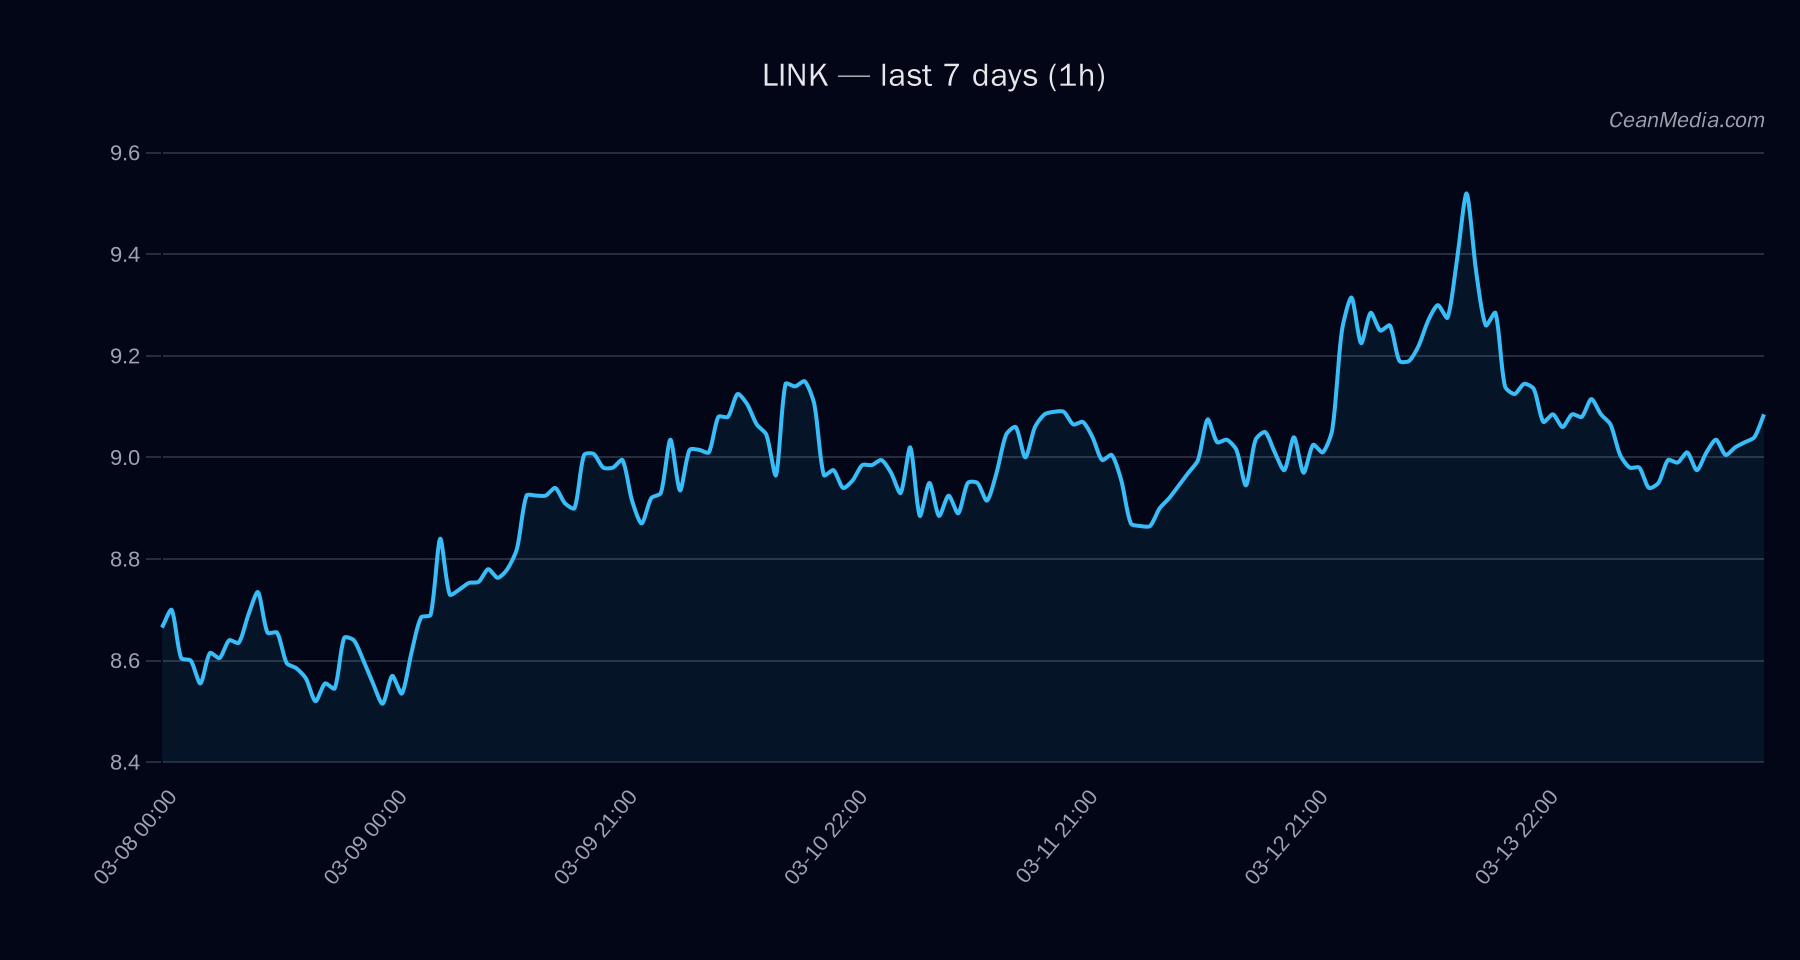
Price: 9.10. Current setup shows LINK trading between key support at 8.92 and resistance at 9.28. Short-term probability favors a downside bias (about 51%), with a 41% probability of upside movement. The instrument exhibits a sideways/negative tilt with EMA12 below EMA26, SMA50 above SMA200, RSI at 56, and a very low 24h volatility regime. Breadth indicators show broadly subdued market participation (Breadth>50h: 0%).
Technical Analysis: LINK
Forecast is DOWN with a probability split of Up 41% / Down 51% / Sideways 8%. - Support (Major): 8.64
- Support (Near): 8.92
- Resistance (Near): 9.28
- Resistance (Major): 9.28
- Upside trigger: 1h close > 9.28 → potential range expansion to 9.4676–9.6533
- Downside trigger: 1h close < 8.92 → potential range to 8.7396–8.5613
RSI 56 indicates neutral momentum; volatility regime described as Very Low. EMA12 < EMA26, SMA50 > SMA200 (bearish/neutral mix typical of a consolidating regime). 8.7546 – 9.4301 9.04898 24h return -0.55%, BTC return -0.76%, Funding Z-Score -2.01, Basis Z-Score -0.28, Order-Book Imbalance EMA5 0.08
Drivers
Return 24h, EMA slope, Funding Z-Score, Basis Z-Score, Order-Book Imbalance (EMA5) Vol regime: Very low; BTC volatility regime negative; BTC trend strength around 0.65 Small positive distance from moving averages (distance_from_ma ≈ 0.0025) modest drawdown and negative breakout signals
ETF Flows (BTC/ETH)
Contextual information: ETF flow data shown are limited to BTC and ETH futures/ETFs and are not primary signals for LINK trading decisions. The BTC ETF shows +$36.8M for 1D, +$0.3M for 5D, and +$86.7M for 10D; ETH ETF shows -$0.3M for 1D, -$21.3M for 5D, and -$58.8M for 10D. This flow context may influence risk sentiment and correlate with risk-on/off dynamics in broader markets.
Interpretation: The net BTC ETF inflow over the 1D window suggests mild risk-on appetite, while ETH flows imply modest risk-off pressure. Overall ETF data should be treated as macro context rather than a direct signal for LINK pricing.
What to Watch Next
- Watch for 1h close above 9.28 to target 9.4676–9.6533 if upside momentum resumes.
- Monitor a 1h close below 8.92 for potential move toward 8.74–8.56 support zone.
- Observe changes in EMA12/EMA26 and RSI for early shifts in momentum; volatility remains very low, which can prolong range-bound behavior.
- Track BTC/ETH ETF flows as macro sentiment gauge, noting that these are contextual indicators and not primary signals for LINK.
Hashtags: #LinkAnalysis #CryptoMarkets #TechnicalAnalysis #ETFFlows #BTC #ETH #MarketSentiment #PriceAction #TradingStrategy #CryptoNews #Altcoins #MarketCommentary