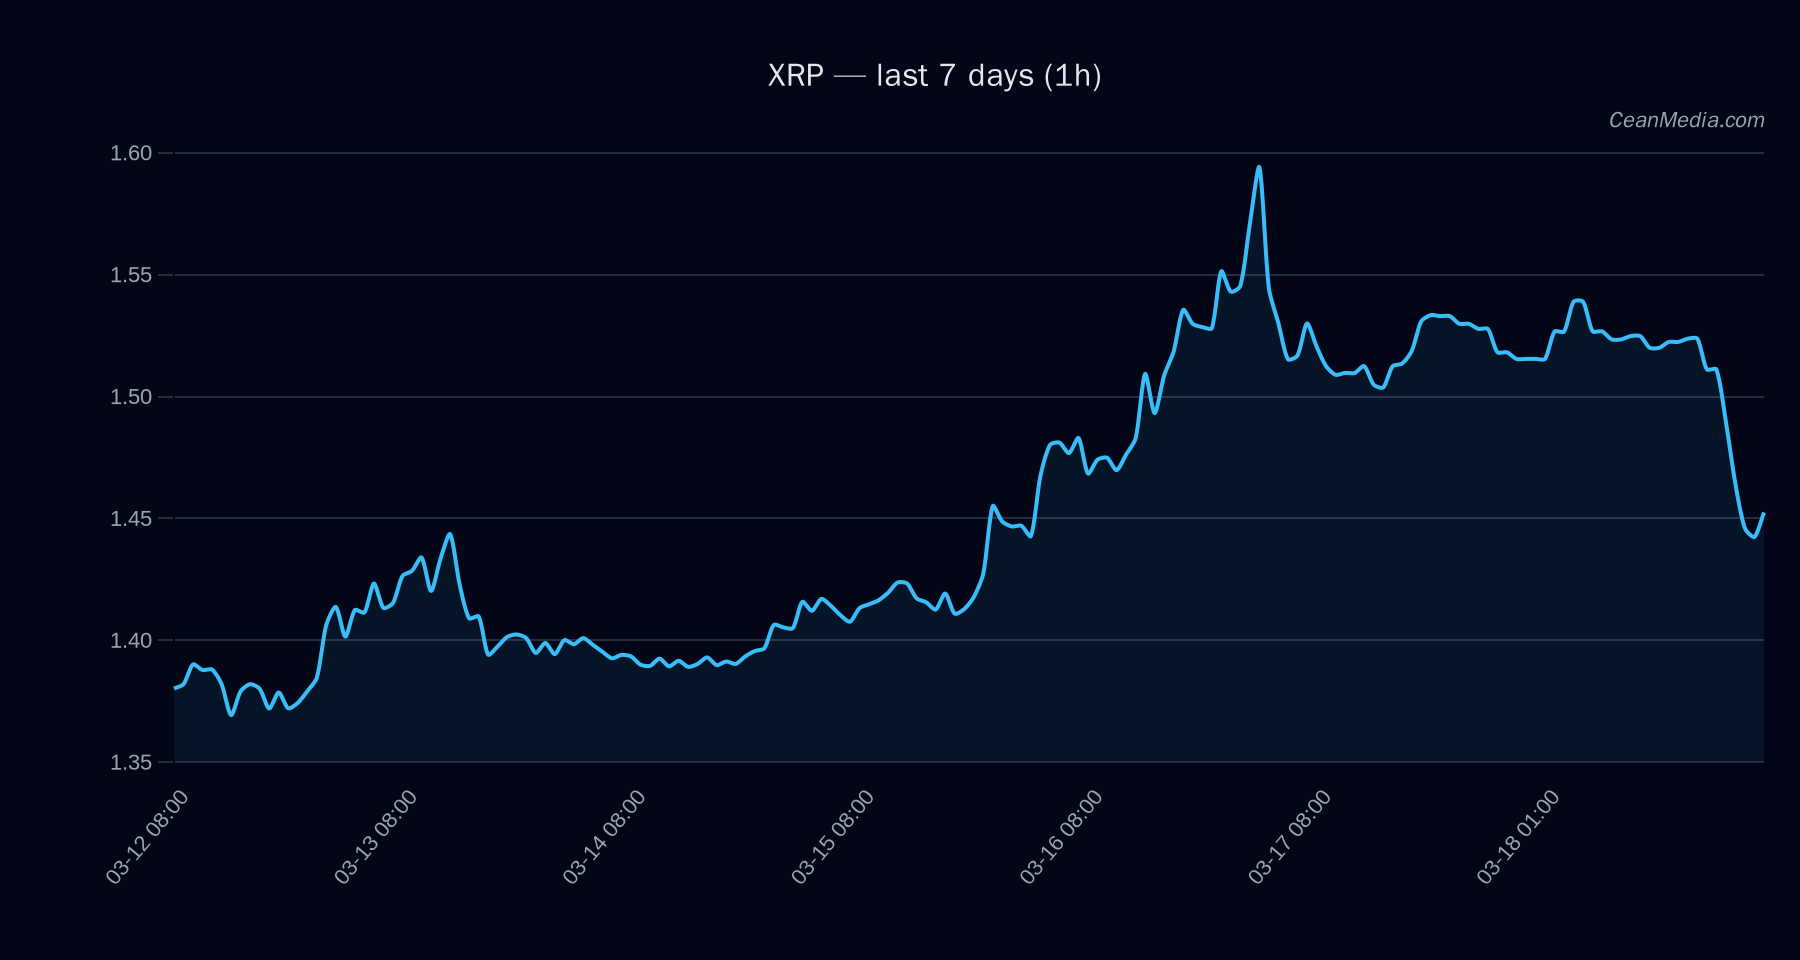
Market Snapshot
Current price: 1.4524 XRP. The market backdrop shows a short-term bullish skew with a measured risk of pullback given oversold indicators and very low volatility regime. Key levels: near-term support at 1.42 and major support at 1.36; resistance near 1.48 with major resistance at 1.50. Upside projections hinge on a close above 1.48, targeting the 1.5111–1.5408 area for the near term. Downside triggers below 1.42 open potential moves toward 1.3949–1.3665.
Technical Analysis: XRP
: - Support: 1.42 (near), 1.36 (major)
- Resistance: 1.48 (near), 1.50 (major)
: - Break > 1.48: potential move toward 1.5111–1.5408
- Break < 1.42: potential move toward 1.3949–1.3665
: Very low vol regime; SMA/EMA configuration indicates a lagging trend with EMA12 < EMA26 and SMA50 > SMA200. RSI is oversold, suggesting limited downside with potential for a bounce.
Drivers
- Top drivers include: 24h return (-0.05), EMA slope (-0.0039), order-book imbalance (EMA5: -0.11), BTC 24h return (-0.039) and BTC trend indicators (1.59)
- Market breadth signals show breadth over 50 hours at 0%, implying limited breadth strength in the immediate horizon
- Volatility regime remains very low with distance from moving averages slightly negative, supporting a cautious upside bias rather than a strong breakout scenario
ETF Flows (BTC/ETH)
Interpretation note: ETF flow data presented here covers BTC and ETH and is contextual rather than a primary signal for XRP. The flows provide situational risk-on/off framing that can influence broader market sentiment and liquidity conditions, which in turn may affect XRP moves indirectly.
- BTC ETF: 1D +$199.4M, 5D +$833.8M, 10D +$461.6M
- ETH ETF: 1D +$140.6M, 5D +$283.1M, 10D +$167.1M
What to Watch Next
- Monitor for a daily close above 1.48 to validate a near-term upside targeting 1.5111–1.5408.
- Watch for a break below 1.42 to assess downside risk toward 1.3949–1.3665.
- Observe BTC/ETH ETF flow momentum for potential risk-on or risk-off shifts that could influence XRP liquidity and sentiment.
- RSI remains oversold; look for a stabilization or a bounce in intraday momentum to confirm the tilt toward upside.
Hashtags: #XRP #CryptoMarkets #TechnicalAnalysis #ETFFlows #BTC #ETH #MarketSnapshot #PriceAction #Liquidity #RiskOn #AltCoins