Market Snapshot
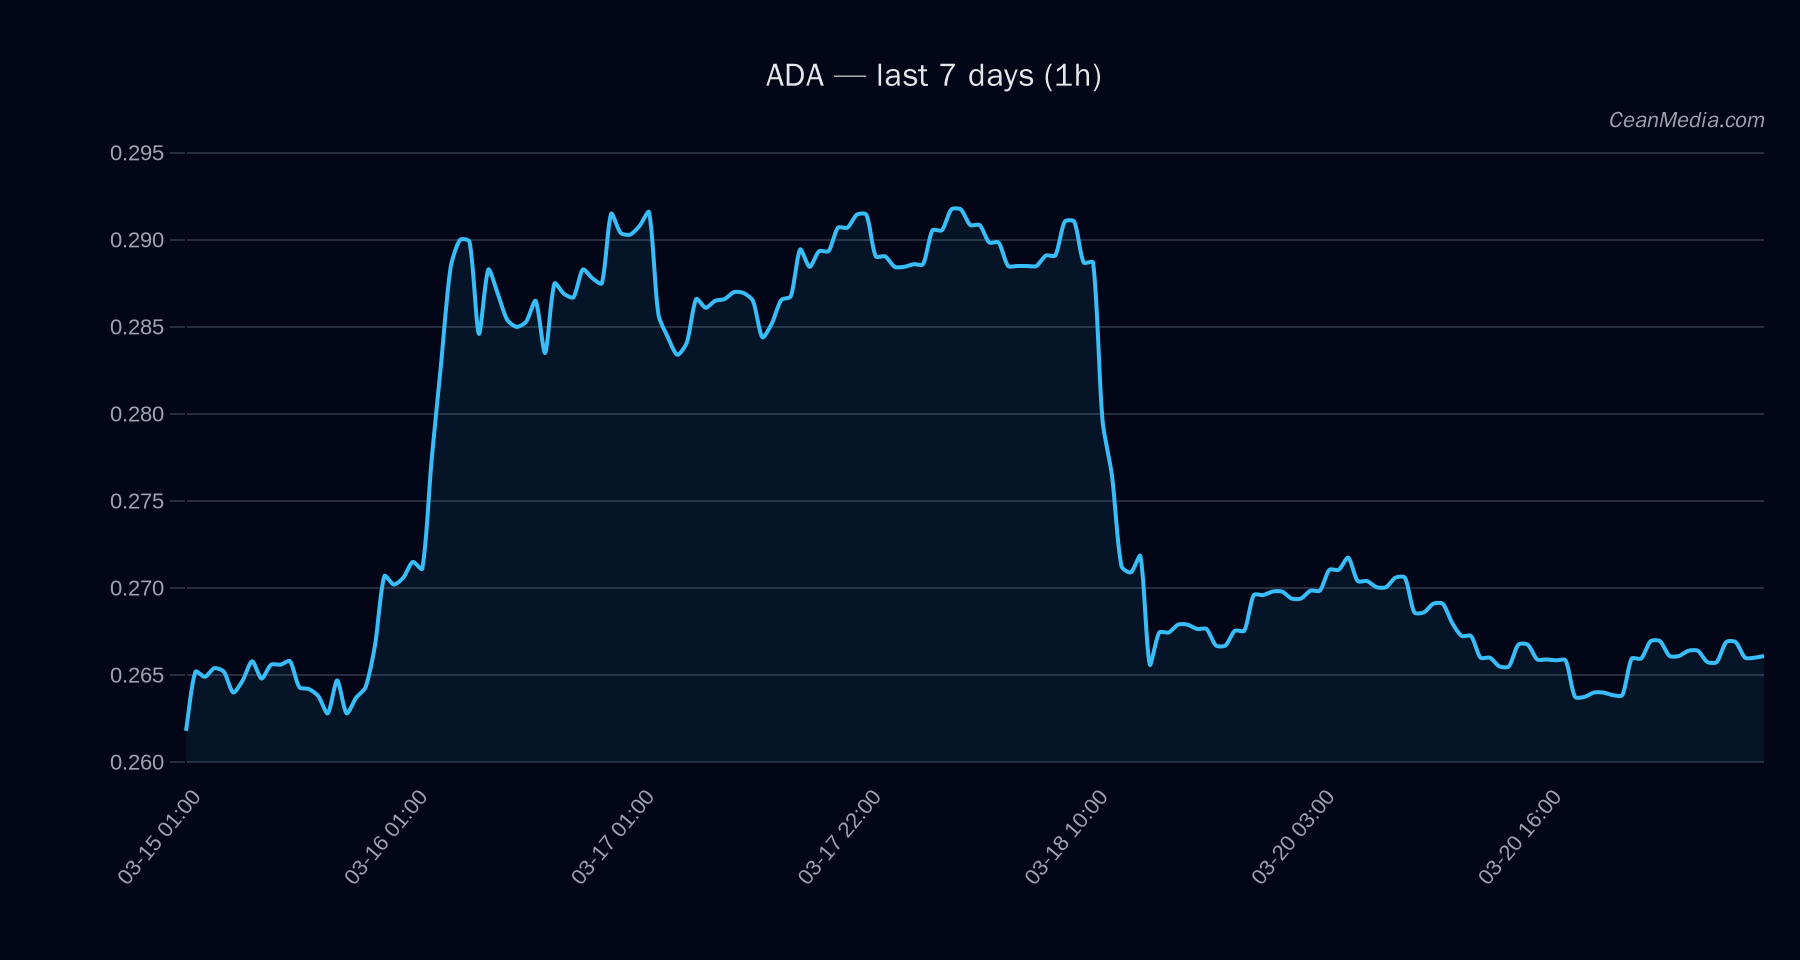
Asset: ADA. Last price around 0.266 with near-term support anchored at 0.26 and resistance near 0.27. The instrument remains within a tight range, with volatility described as Very low. breadth indicators show Breadth>50h at 0%, and the overall 72h BTC correlation sits at 0.64, suggesting modest linkage to broader BTC moves while ADA-specific dynamics remain the primary driver for near-term directions.
Technical Analysis: ADA
Support near 0.26 with a major support at 0.255; resistance near 0.27 with major resistance at 0.285. Break > 0.27 targets 0.2773–0.2827; Break < 0.26 targets 0.2559–0.2507. P50 (mid) around 0.263; Band (P20–P80) spans 0.2489–0.2683. RSI at 44, EMA12 < EMA26, SMA50 > SMA200. Volatility regime is Very low (σ24h ≈ 0.39%), indicating subdued trading activity. Break above 0.27 supports upside continuation toward 0.2773–0.2827. Break below 0.26 reinforces the downside scenario toward 0.2559–0.2507. Forecast: sideways with a slight tilt to downside. Conditional moves depend on price interaction with 0.27 and 0.26 levels.
Drivers
24h return for ADA is -0.02, EMA slope marginally negative (-0.0001), Order-Book Imbalance (EMA5) at 0.03, BTC 24h return at -0.002, BTC trend strength 0.11. Vol regime is Very low; vol-of-vol indicator at 0.01 suggests stable but low activity environment; trend strength around 0.95 in some measures indicates internal momentum pressure but not decisive direction yet. Breadth metrics show weak breadth signals (Breadth>50h at 0%), ρ(BTC,72h) at 0.64, implying a partial alignment with BTC over the near term but with asset-specific dynamics prevailing.
ETF Flows (BTC/ETH)
Context: ETF flow data is provided for BTC and ETH and is not a primary signal for ADA. It serves as market context regarding risk appetite and liquidity shifts in broader crypto markets. Recent data shows: BTC ETF: 1D -$6.1M, 5D +$177.3M, 10D +$321.2M; ETH ETF: 1D -$16.0M, 5D +$89.8M, 10D +$103.1M. Netflows suggest mixed near-term risk-on/off signals in large-cap crypto, with ETH showing modest inflows over longer windows while BTC experiences a recent one-day outflow. These patterns should be considered as contextual to ADA but not a direct trading signal for ADA price action.
What to Watch Next
- Watch for a close above 0.27 to validate the upside target range of 0.2773–0.2827.
- Monitor a break below 0.26 for potential acceleration toward 0.2559–0.2507.
- Observe BTC/Eth flows for signs of changing risk sentiment, while recognizing ADA responds primarily to its own micro-structure and liquidity.
- Maintain awareness of Very low volatility environment which may lead to abrupt breaks on news or shifts in market structure.
Hashtags: #ADA #Cardano #CryptoAnalysis #TechnicalAnalysis #ETFFlows #BTC #ETH #MarketUpdate #CryptoMarkets #Liquidity #RiskOn #MarketStructure
Note: ETF data included here covers BTC and ETH only and is provided for contextual market sentiment. It should not be treated as a primary signal for ADA trading decisions.