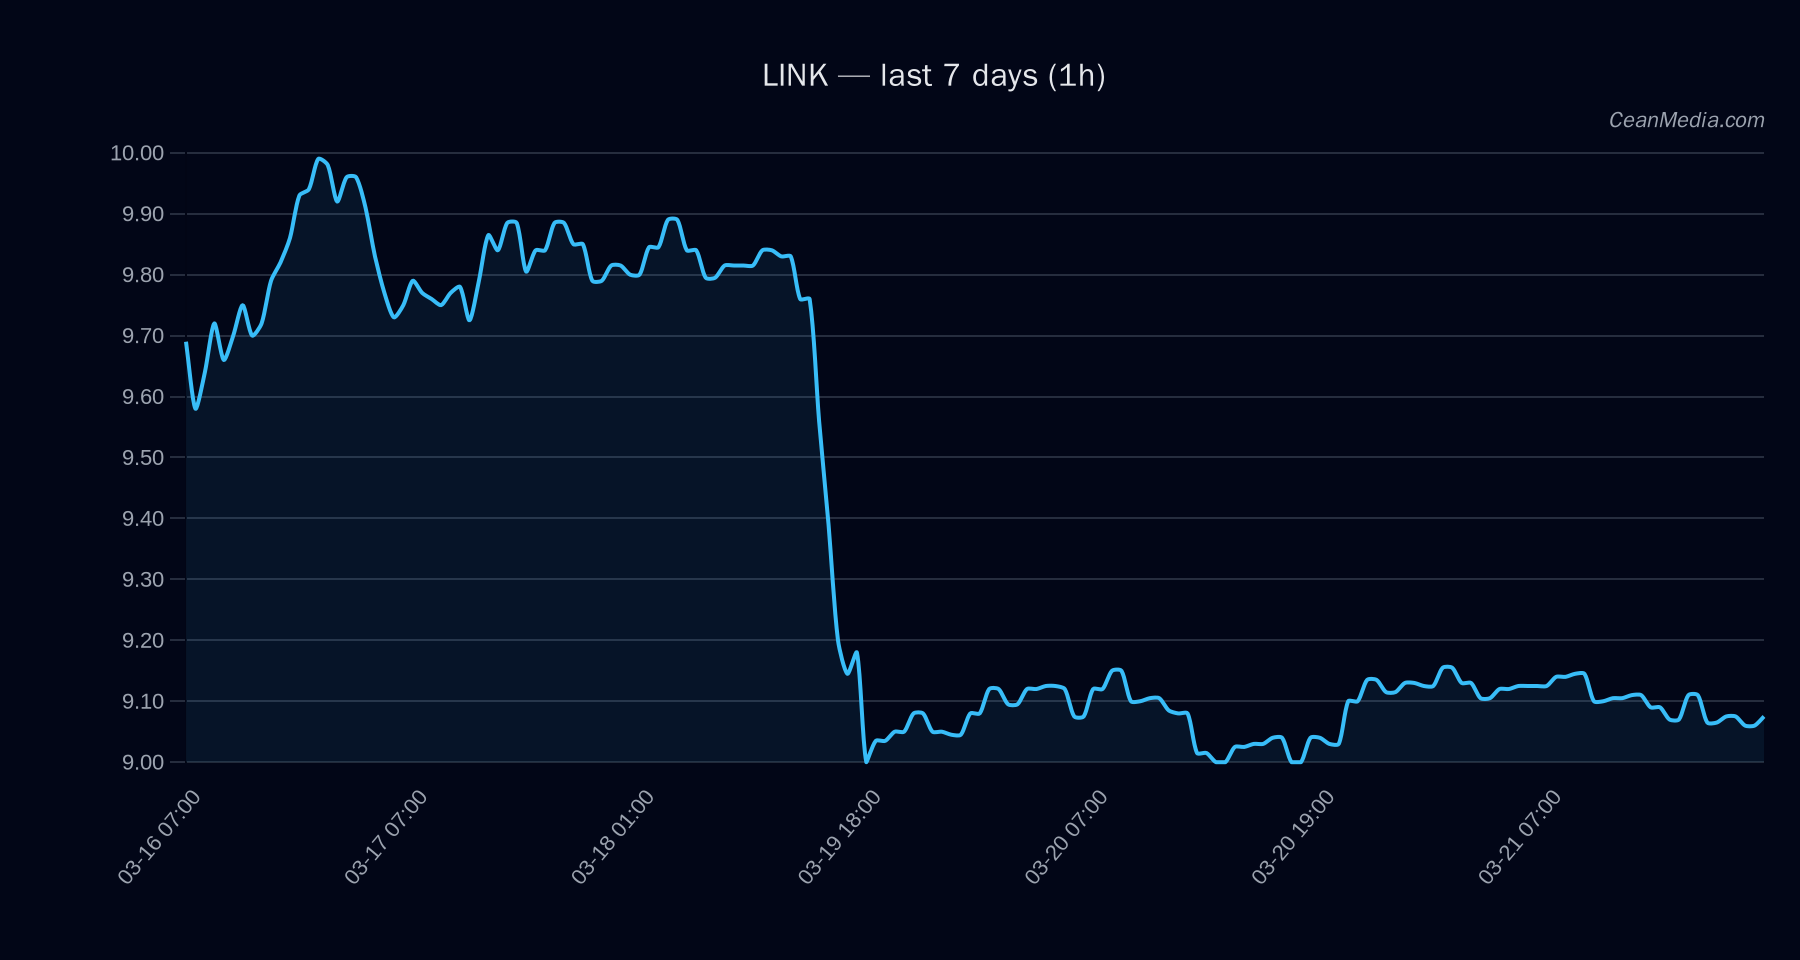
Market Snapshot
On 2026-03-21, LINK traded around 9.07 with a short-term forecast indicating upside probability (~54%). The price action sits between a major support of 8.76 and a near-term resistance of 9.26. The immediate breakout target if resistance is exceeded is 9.4364–9.6215, while a break below support could unfold to 8.7108–8.5331. The volatility regime is noted as very low, with RSI at 44, suggesting a neutral to mildly bearish technical tone in the short term despite the upside forecast.
Technical Analysis: LINK
Drivers
Return 24H: 0.0039; EMA slope: -0.0003; OB/OBI: -0.01; BTC Return 24H: 0.0030; BTC Trend Strength: 0.25. 24h σ = 0.29%, Vol regime: Very low. RSI: 44 (neutral). F&G: 12 (Extreme Fear) in broader market context. BTC dominance around 56.4% (down 0.4% over 7d). 7-day cash flow and order-book dynamics modest in magnitude, aligning with a cautious risk environment.
ETF Flows (BTC/ETH)
ETF flow data provided pertains exclusively to BTC and ETH. BTC ETFs show a 1D negative flow of -$6.1M but positive 5D and 10D net inflows (+$177.3M and +$321.2M respectively). ETH ETFs display a 1D negative flow of -$16.0M with positive multi-day inflows (+$89.8M over 5D and +$103.1M over 10D). These flows reflect shifting risk appetite and timing of institutional allocations but should be interpreted as contextual rather than a primary signal for LINK. In other words, ETF movements offer mood and liquidity context for macro risk, not a direct predictor for LINK’s price action.
What to Watch Next
- Watch for a daily close above 9.26 to validate the upside breakout path toward 9.4364–9.6215.
- Monitor if price holds above 8.88; a sustained close below could invite downside toward 8.71–8.53.
- Observe changes in BTC-focused ETF flows for potential risk-on/off shifts that may correlate with broader liquidity conditions.
- Keep an eye on volatility regime shifts from very low to higher levels, which could precede a more directional move in LINK.
Hashtags: #LinkAnalysis #Cryptocurrency #TechnicalAnalysis #MarketSnapshot #ETFFlows #BTC #ETH #CryptoMarkets #PriceAction #TradingStrategy #RiskManagement