Market Snapshot
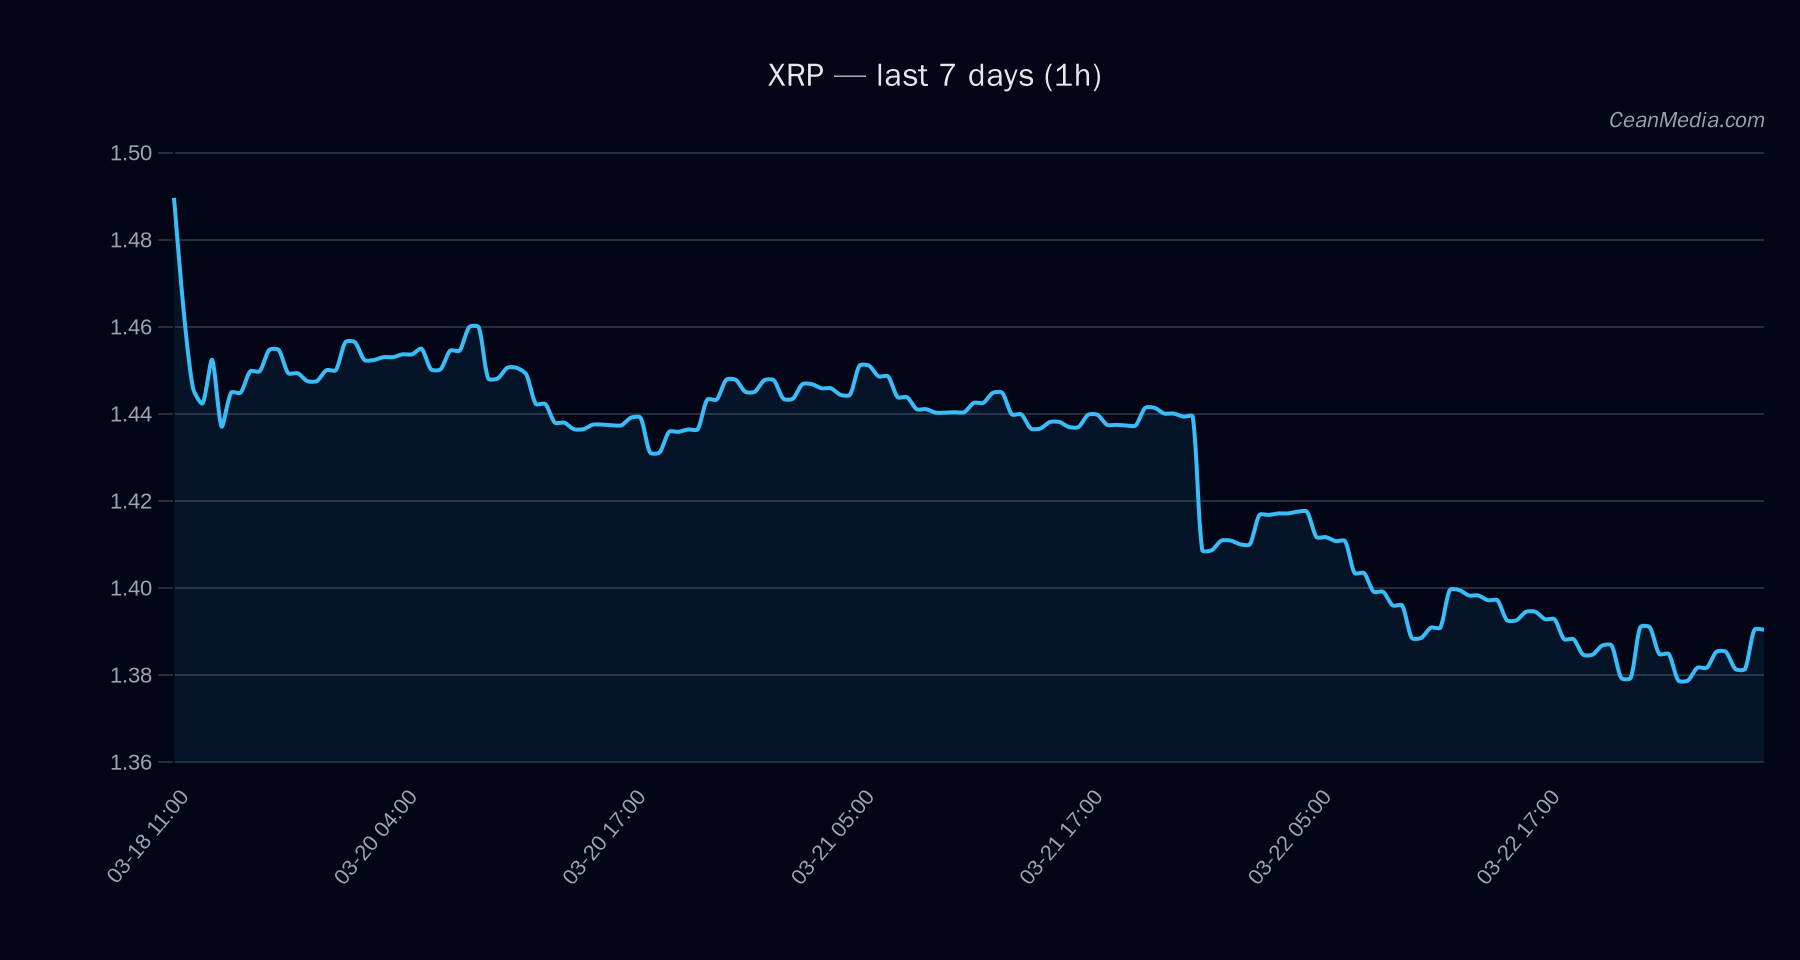
XRP is trading near the key support and resistance band, with the current price around 1.39. The short-term forecast edges to the downside, supported by bearish technical signals and very low volatility. The instrument remains within the 1.36 major/near support and 1.42 near resistance corridor, with a potential breakout bias if price closes above 1.42 or breaks below 1.36.
Technical Analysis: XRP
- Current price: 1.3923
- Trend condition: EMA12 < EMA26; SMA50 < SMA200 (bearish configuration)
- Momentum: RSI 47 (neutral)
- Volatility: σ24h 0.39%, very low regime
- Band: Price within P20–P80: 1.3042 – 1.4234
- Support: Major 1.36; Near 1.36
- Resistance: Major 1.5; Near 1.42
- Upside potential (intraday): 1h close > 1.42 → 1.4485 … 1.477
- Downside risk (intraday): 1h close < 1.36 → 1.3372 … 1.3099
- Forecast: Down (46% probability to the downside; TA bearish)
- Key triggers: Break above 1.42 favors a move toward 1.4485–1.477; break below 1.36 suggests a move toward 1.3372–1.3099
Drivers
- Return over the last 24 hours: -0.02
- EMA slope: +0.0004
- Order-book imbalance (EMA5): -0.0044
- BTC 24h return: -0.01
- BTC volatility regime: 0 (stable)
- BTC trend strength: 0.59
- Other indicators point to low breadth and subdued volatility, with overall risk tone leaning modestly negative for XRP in the near term.
ETF Flows (BTC/ETH)
Context: ETF flow data shown here is for BTC and ETH. This information offers macro-market context but is not a primary signal for XRP pricing. The flows can reflect investor sentiment and risk appetite, which may influence correlated assets, but XRP-specific dynamics should be evaluated independently.
- BTC ETF: 1D -$52.0M; 5D +$131.4M; 10D +$275.3M
- ETH ETF: 1D -$42.0M; 5D +$63.8M; 10D +$77.1M
What to Watch Next
- Watch for a daily close above 1.42 to shift the short-term bias toward the 1.45–1.48 area.
- Monitor a daily close below 1.36 for confirmation of a downside extension toward 1.31–1.34.
- Keep an eye on BTC/ETH flow signals as a contextual gauge of risk sentiment, without treating them as XRP drivers.
- RSI remains neutral around 47; any sustained move near extremes could precede a sharper move outside the current band.
Hashtags: #XRP #CryptoAnalysis #MarketSnapshot #TechnicalAnalysis #ETFFlows #BTC #ETH #CryptoTrading #PriceAction #SupportAndResistance #RiskManagement #MarketContext