Market Snapshot
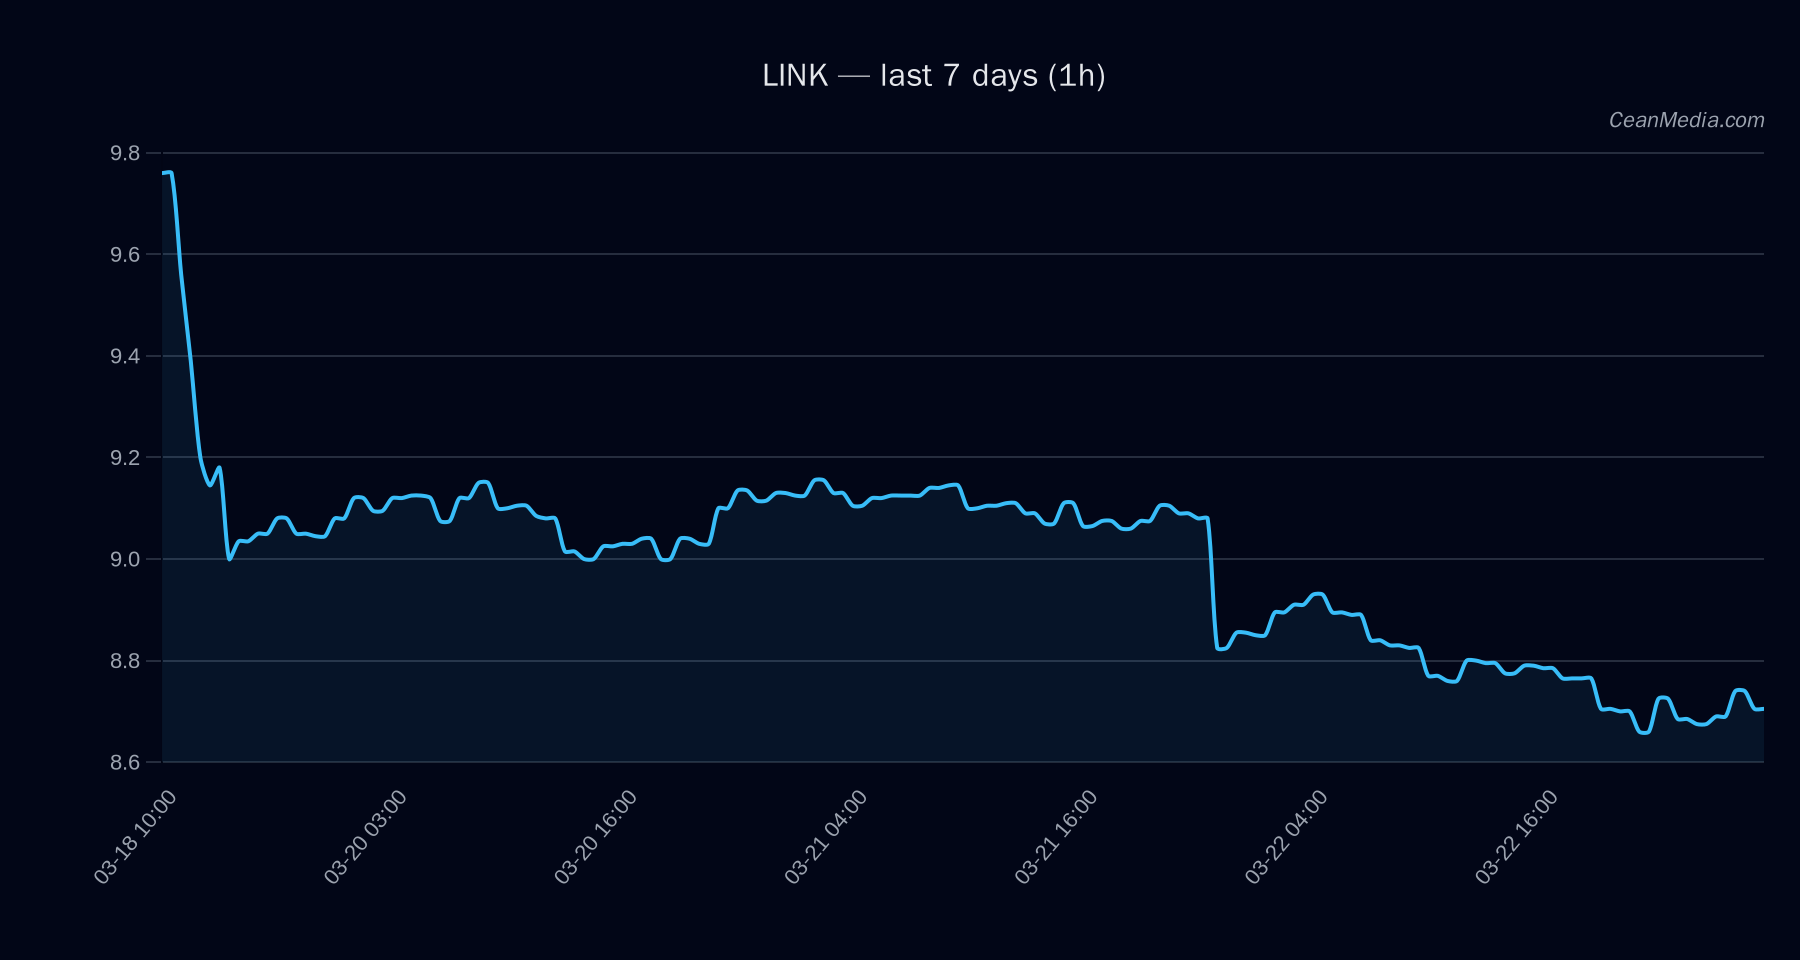
On 2026-03-23, LINK trades around the $8.70 area with a short-term up bias implied by the data. The immediate range sits between major support at 8.72 and major resistance at 9.56, with a near-term pivot closer to 8.56. The broader context shows a very low volatility regime and a neutral-to-bearish technical stance based on standard indicators.
Technical Analysis: LINK
- Current price: 8.73
- Short-Term Forecast: up (48%)
- Key indicators: EMA12
- Volatility regime: Very low (σ24h 0.35%)
- Band / Range: P20–P80: 8.003 – 9.043; P50: 8.586
- Support: Major 8.72, Near 8.56
- Resistance: Major 9.56, Near 8.90
- Upside trigger: 1h close > 8.90 → 9.0827 … 9.2608
- Downside trigger: 1h close < 8.56 → 8.3843 … 8.2132
- Bias: Forecast: up (48%), TA: bearish (EMA12
Invalidation parameters: Break below 8.56 would invalidate the near-term upside and shift the path toward the lower bound of 8.21–8.38 depending on momentum. A breakout above 8.90 would open the 9.08–9.26 region.
Drivers
- Return 24H: -0.02
- EMA slope: -0.0004
- Order-book imbalance (EMA5): 0.07
- BTC 24H return: -0.02
- BTC volatility regime: 0
- BTC trend strength: 1 (high)
- Volatility regime for LINK: Very low
Overall momentum signals are modest with a neutral-to-soft-bearish read in classic indicators, while BTC-related momentum appears resilient in the short term. The depth of order-book imbalance provides a subtle supportive tilt for micro-movements around the current range.
ETF Flows (BTC/ETH)
Context: ETF flow data provided here is limited to BTC and ETH and is intended to inform macro risk sentiment rather than serve as a primary signal for LINK. The numbers indicate recent directional flows rather than actionable timing signals for LINK. The data show:
- BTC ETF: 1D -$52.0M, 5D +$131.4M, 10D +$275.3M
- ETH ETF: 1D -$42.0M, 5D +$63.8M, 10D +$77.1M
Interpretation: The BTC/ETH ETF flows point to a mixed-to-positive risk-tolerance tilt over 5–10 days, with notable net inflows in BTC over longer horizons, which can support risk-on conditions for correlated assets. However, ETF data is not a direct signal for LINK and should be viewed as a contextual backdrop affecting market breadth and correlation-driven moves.
What to Watch Next
- Watch for a close above 8.90 to validate upside momentum toward 9.08–9.26.
- Monitor a break below 8.56 as a potential shift toward the 8.20–8.38 region.
- Keep an eye on BTC price behavior and the BTC trend strength as a cross-asset sentiment proxy.
- Observe changes in volatility regime; a shift from very low could precede larger intraday moves.
Hashtags: #crypto #LINK #marketanalysis #tradingview #technicalanalysis #ETFflows #BTC #ETH #riskmanagement #tradingsetup #blockchain #finance